
Economic Anxiety Didn’t Elect Trump and It May Hurt His Party in the Midterms
Robert Griffin, John Sides
The New York Times October 10, 2018
Economy, Race & Ethnicity, Socio-Economic
Key Findings
The prevailing narrative of the 2016 presidential election and its aftermath focused heavily on the economic concerns of Americans, particularly among one key subset of the population — the “white working class,” often defined as white people without a four-year college degree. These anxieties were said to be of unusual political salience, contributing to Donald Trump’s success, especially with the white working class.
Our research suggests that this storyline is flawed. In the years leading up to the election, economic anxiety was actually decreasing, not increasing, as the recovery from the Great Recession gradually improved people’s assessments of the economy.(1) In fact, what was distinctive about voting behavior in 2016 was not the outsized role of economic anxiety. Instead, attitudes about race and ethnicity were more strongly related to how people voted.(i)
In the 2018 VOTER Survey (Views of the Electorate Research Survey), we measure economic “distress,” as defined by an individual’s response to a number of detailed questions about personal financial stability. Conventional measures of economic “anxiety,” defined by an individual’s broad-based economic perceptions, are more likely to reflect that person’s political leanings, as a president’s co-partisans typically rate the economy more favorably than do people aligned with another party.(ii)
(1) See, for example, the trend in the Index of Consumer Sentiment from the University of Michigan’s Surveys of Consumers: http://www.sca.isr.umich.edu/files/chicsr.pdf.
Contrary to the popular narrative, VOTER Survey results show that economic distress is not distinctively prevalent among the white working class. It is much more a fact of life for people of color. In part because of this, Trump voters in 2016 do not report more economic distress than do Clinton voters. If anything, the opposite is true.
Economically distressed Americans are, unsurprisingly, more pessimistic about economic mobility and the “American dream.” They are also more likely to support government policies intended to redistribute wealth. This is true of Americans overall as well as white people who report economic distress by our definition.
The political implications of economic distress are mostly negative for President Trump. Among independents in particular, those experiencing economic distress are more likely to disapprove of Trump’s performance in office. Therefore, economic distress appears to function as a referendum on Trump’s presidency rather than a driver of support. Indeed, genuine economic distress may cost Trump support.
A typical approach to measuring the economic concerns of Americans is to ask them general questions about the state of their own finances as well as the nation’s economy overall. The problem with these measures, however, is that they are powerfully and increasingly contaminated by partisan bias.(iii) All else equal, Americans feel better about the economy when their party controls the White House.
This was a telling feature of public opinion before the election. According to YouGov/The Economist polls, Republicans in the highest family income quintile (those making more than $100,000 per year) were slightly less satisfied with the national economy than Democrats in the lowest income quintile (those making less than $20,000 per year).(iv) And it has been a telling feature after the election as well. The 2016 VOTER Survey asked Americans in December 2016 about whether their life, the economy, and their family finances were getting better or worse — and posed these general questions to the same Americans in July 2017. There was a predictable partisan flip-flop: After Trump’s election, Democrats felt worse about their quality of life and the economy, while Republicans became much more optimistic.(v)
These findings underscore the need to measure economic concerns in a way that mitigates partisan bias. To do this, both the 2017 and 2018 VOTER Surveys employed a different set of questions. Rather than elicit subjective opinions about the economy, these questions asked about direct experiences with financial instability or hardship as well as views of aspects of personal economic circumstances.
The questions included:
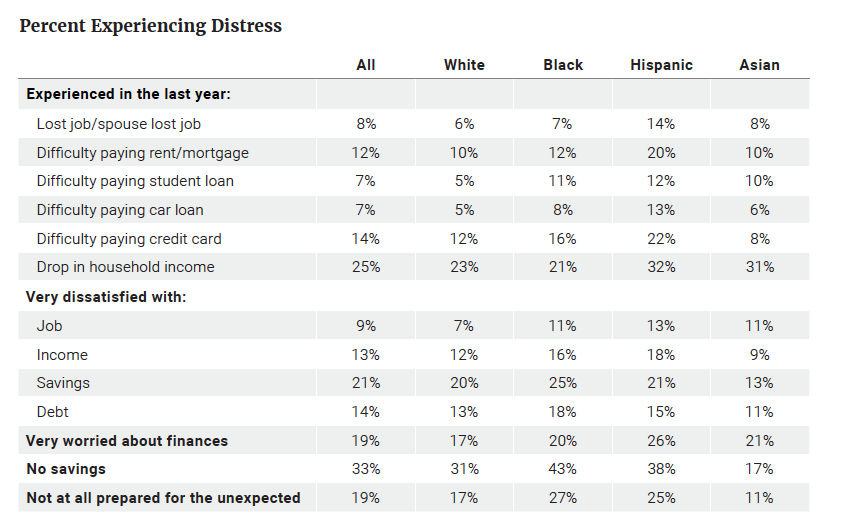
Among all the 2018 VOTER Survey respondents, 19 percent reported being “very worried” about their finances and a similar proportion said that they were not prepared for the unexpected (Table 1). A smaller number reported being “very dissatisfied” with their job or income.
A key economic vulnerability was savings. A third of respondents reported that they did not have savings set aside and about one in five (21 percent) said that they were very dissatisfied with their savings. About 7 percent said they have had difficulty paying a student loan — a large percentage given that only 16 percent of American adults report having outstanding student loan debt.(vi)More than one in 10 reported having difficulty with housing costs (12 percent) or credit card debt (14 percent). Fully a quarter of respondents reported a drop in household income in the past year.
Table 1
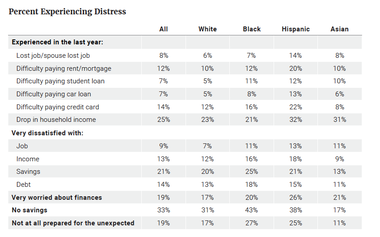
On average, economic distress is higher among black people and Hispanics than among white people and, on some measures, than among Asians and those of another race. For example, a larger proportion of black and Hispanic Americans report not having savings and/or being very dissatisfied with their savings. Indeed, black Americans are as likely as or more likely than white Americans to report economic distress on nearly every measure.
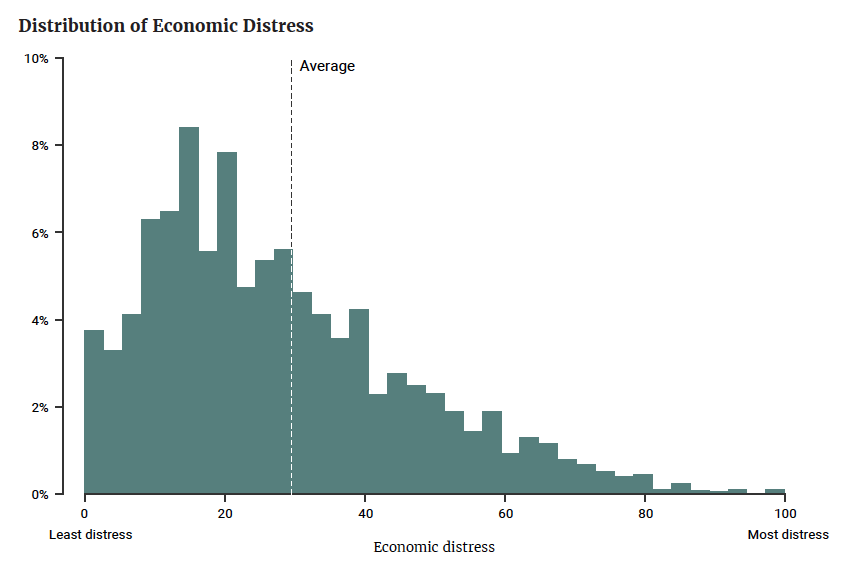
Averaging responses to these questions provides an overall measure of what we call “economic distress.” For simplicity’s sake, we have put this measure on a zero to 100-point scale, where 100 points indicates the highest level of distress. Statistical analysis suggests that this approach is a reliable way to combine these different questions, which appear to be tapping the same underlying attribute.(2)
For the entire sample, the average level of economic distress on this scale is about 29 points (Figure 1). Most respondents (75 percent) fall between zero and 40 points. If a “high” level of economic distress is defined as being in the most-distressed 25 percent of the sample, then this would include anyone above 40 points on this zero to 100-point scale.
(2) In statistical terms, the reliability of the scale is high (alpha = 0.84), and factor analysis suggests one underlying dimension, not multiple dimensions.
Figure 1

Economic distress was stable across the eight months between the 2017 and 2018 VOTER Surveys. The average in 2017 on our scale of zero to 100 points was 28 points and in 2018 it was 29 points. Among the 4,656 respondents included in both surveys, the correlation of economic distress between each wave was 0.79 (where the maximum positive correlation is 1.0).
Economic distress is, unsurprisingly, correlated with perceptions of the economy as gauged by traditional survey questions. Those who said that the national economy was improving averaged 23 points on this scale while those who said it was about the same averaged 30 points. Those who said it was getting worse, however, averaged 36 points — and fully 39 percent of this “getting worse” group also fell into the “high distress” group scoring above 40 points on the zero to 100-point scale, compared to 25 percent of those in the “high distress” group who said the economy was the same and 16 percent who said it was getting better. The correlation between these measures is 0.25.
Economic distress was even more strongly correlated with people’s general perceptions of their personal finances. Those who said their finances were getting better averaged 20 points, while those who said they were worse off averaged 44 points. While just 10 percent of those who said their finances were doing better fell into the “high distress” group, more than half (56 percent) of those who reported doing worse were categorized as such. The correlation between these measures was 0.45.
These positive correlations, however, are far from perfect — opening the possibility that the contours of economic distress will not fully resemble the contours of economic perceptions captured through traditional measures.
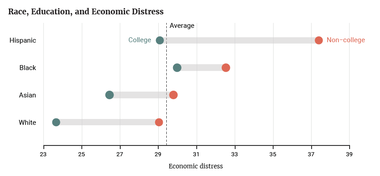
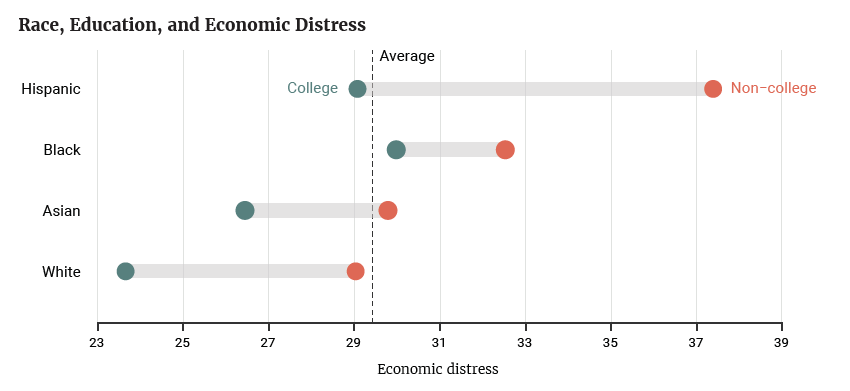
With media narratives before and after the 2016 presidential election focused on the distress experienced by working-class white people with less formal education, it is important to ask: How justified is this focus? Do white Americans with less formal education experience distinctively higher levels of economic distress than other groups?
In short, no. It is true that white people with lower levels of education report higher levels of economic distress than do white people with college degrees — with scores of 29 points and 24 points, respectively (Figure 2). Similarly, a higher percentage of non-college white people are in the “high distress” group — 25 percent vs. 16 percent. But white people without a college degree do not report uniquely high levels of distress.
Both black people (33 points) and Hispanics (37 points) without a college degree report higher average levels of distress. Moreover, a higher percentage of black people (31 percent) and Hispanics (38 percent) without a college degree fall into the “high distress” group.
In fact, white Americans without a college degree report less economic distress than black and Hispanic Americans with a college education (30 points and 29 points, respectively). And slightly more black (28 percent) and Hispanic (26 percent) Americans with college degrees fall into the “high distress” category, compared to white Americans without a college degree.
Figure 2
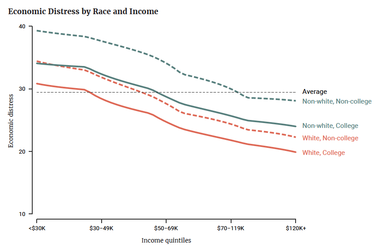
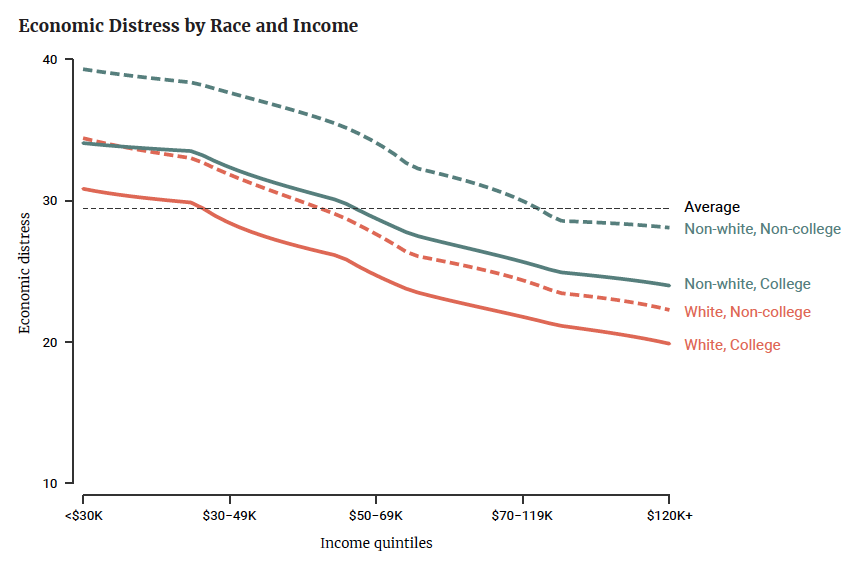
These differences are not simply due to income disparities in these groups. Unsurprisingly, reports of economic distress are more common among those with lower incomes. But white people without college degrees report more distress than college-educated white people even when they have similar incomes (Figure 3).
Notably, however, white people without college degrees, regardless of their income, report a level of economic distress similar to that of people of color who do have a college degree. The group that consistently reports the most economic distress are people of color who lack a college degree, and this is true at every income level.
Figure 3
If economic distress depends on race, education, and income, it does not depend much on partisanship. The distribution of economic distress is similar among Democrats and Republicans, where party identification was measured along a seven-point scale in the 2016 VOTER Survey (Figure 4).
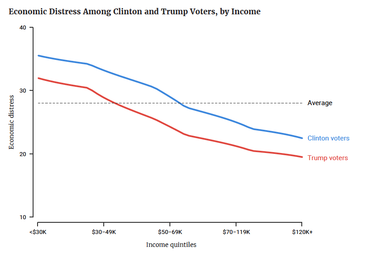
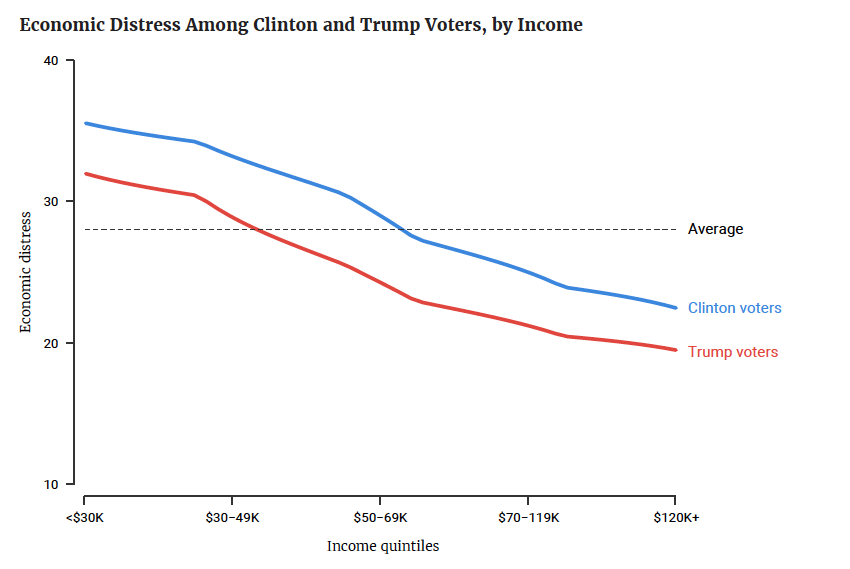
Average levels of economic distress were also somewhat similar for Trump voters (25 points) and Clinton voters (30 points). If anything, Clinton voters expressed more economic distress — an unsurprising fact given the higher levels of economic distress among the racial minorities that make up a large proportion of the Democratic Party. Clinton voters expressed slightly more distress at every income level (Figure 5).
Figure 4
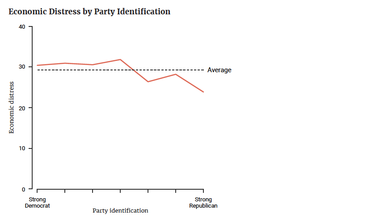
Figure 5
This very modest relationship between partisanship and economic distress is much different than the powerful relationship between partisanship and traditional subjective measures of how the economy is doing. The correlation between economic distress as we measure it and party identification is -0.11 because higher values of party identification (i.e., people who more strongly identify as Republican) report less distress. The correlation between party identification and traditional evaluations of the national economy, however, is 0.44 because Republicans are far more likely than Democrats to say that the economy is getting better. In absolute terms, then, the correlation between party identification and this arguably more subjective traditional measure is four times greater than the correlation between party identification and economic distress.
One potential objection to our findings is that this measure of economic distress comes from surveys conducted after the 2016 presidential election. Perhaps Republicans did report higher levels of economic distress than Democrats did before the election — and then these partisan differences became muted as Republicans and Democrats did the typical flip-flop after the election. Gallup data suggest that between 2016 and 2017, financial worries dropped among all Americans, but more steeply among Republicans than Democrats.(vii)
However, other data from before the election do not show more economic distress among Trump supporters than Clinton supporters. In the fall of 2016, the American National Election Study asked respondents if they were concerned about their finances, about losing their job, about not making their rent or mortgage payment, or about not being able to pay for health care. About 10 percent of Clinton voters thought losing their job was “very likely” or “extremely likely,” compared to 7 percent of Trump voters. Twenty-three percent of Clinton voters and 24 percent of Trump voters said it was very or extremely likely that they would not be able to pay all their health care costs. There were similar small differences in responses to the other questions.
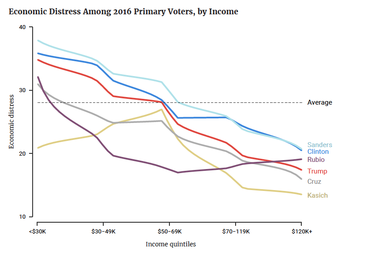
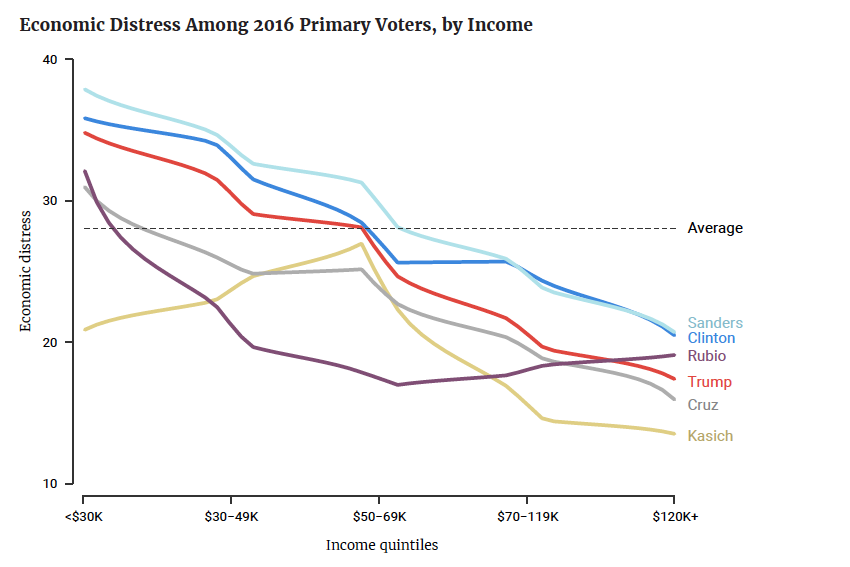
Even among Trump’s base of support — Republicans who had supported him in the primary — there was not a distinctively higher level of economic distress as of the 2018 VOTER Survey (Figure 6). At virtually every income level, Trump primary voters reported less distress than supporters of either Senator Bernie Sanders or Hillary Clinton. However, Trump primary voters tended to express more distress than Republican primary voters who supported Senator Ted Cruz, Senator Marco Rubio, or Governor John Kasich, except those in the two highest income quintiles. But it is not clear that economic distress was the factor motivating Trump primary supporters. Analysis based on contemporary data from the primary shows that views of the economy and economic mobility had only a weak relationship to Trump support, once other factors were taken into account.(viii)
Figure 6
What about Trump supporters who had been Barack Obama supporters in 2012? Were they different than, say, the Obama supporters who voted for Hillary Clinton in 2016? We can identify both groups using the VOTER Survey’s earlier polls of these respondents in November 2012 and December 2016. Among roughly 4,200 respondents surveyed in both the 2017 and 2018 VOTER Surveys, there was no difference in economic distress between Obama-Trump voters and Obama-Clinton voters in 2017, and only a small difference as of the 2018 VOTER Survey, when Obama-Trump voters reported slightly more economic distress than did Obama-Clinton voters (33 points vs. 30 points on our zero to 100-point scale, respectively). The larger difference was between Obama-Trump voters and Romney-Trump voters, whose economic distress score was 23 points in 2018.
Of course, by measuring economic distress in the 2018 VOTER Survey — nearly two years after these respondents were surveyed about their primary vote preferences and almost 18 months after respondents were surveyed about their general election preferences — it is not possible to make a causal argument about the impact of economic distress on how people voted. But this pattern does confirm evidence from earlier surveys showing that economic distress was not a distinctive feature of support for Donald Trump.(ix)
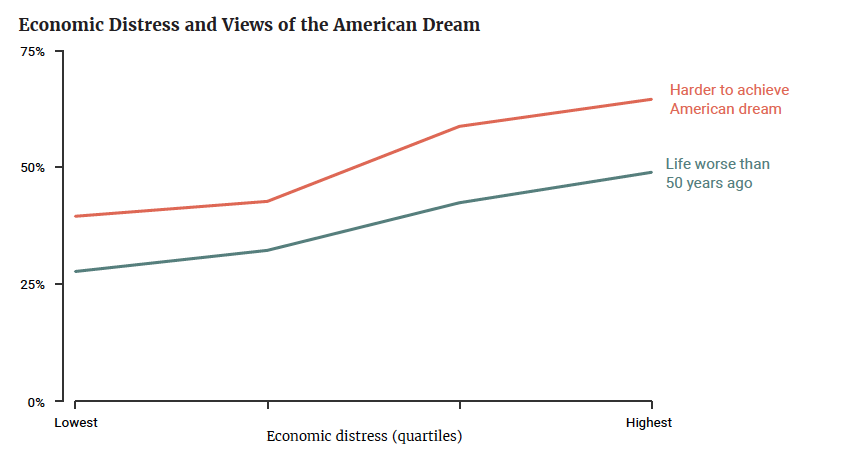
Although economic distress is only weakly related to partisanship, it does have a sizable and predictable relationship to several political attitudes. For one, respondents who report more economic distress are more likely to express pessimism about their lives (Figure 7). Among those who express a high level of economic distress (the top quartile of this measure), 65 percent say that compared to their parents, “it is harder to achieve the American dream.” By comparison, 40 percent of those who express little economic distress (the bottom quartile) say this. Similarly, 49 percent of those who express a great deal of distress say that “life in America is worse today than it was 50 years ago” for people like themselves, compared to 28 percent of those who express little economic distress.(3)
Figure 7
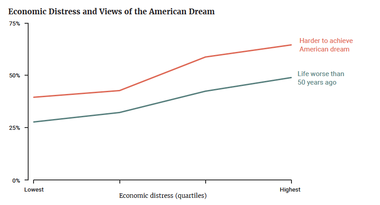
(3) There are similar gaps in whether people think their living standards are worse than their parents when they were the same age. There is, however, only a modest relationship between economic distress and responses to the standard “right direction vs. wrong track” question.
Economic distress does not translate into a radically different set of policy priorities — with one key exception (Figure 8). In the 2017 VOTER Survey, when these priorities were last assessed, the percentage of respondents who said that the economy, jobs, and health care were “very important” is similar regardless of their economic distress. However, those who express higher levels of distress are more likely to say that poverty is very important.
Figure 8

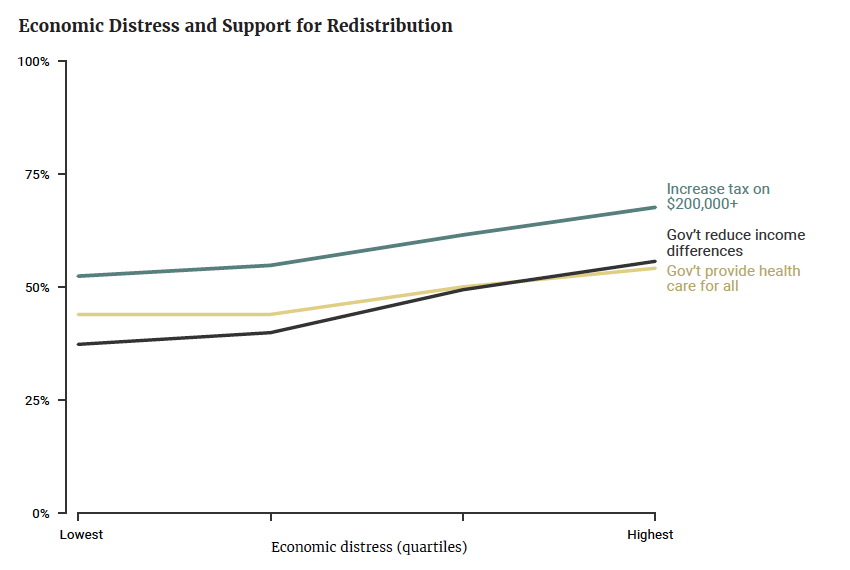
Given these patterns, it is no surprise that economic distress is related to support for redistributive policies in the 2017 VOTER Survey (Figure 9). Compared to those who express relatively little distress, those who express a great deal are 18 percentage points more likely to say that the government should do more to “reduce income differences between rich and poor,” 15 percentage points more likely to support raising taxes on families who make $200,000 or more, and 10 percentage points more likely to say that it is the federal government’s responsibility to “see to it that everyone has health care coverage.” The correlation between economic distress and economic liberalism is weaker among Democrats, most of whom already support these ideas, but is stronger among Republicans and independents.
Figure 9
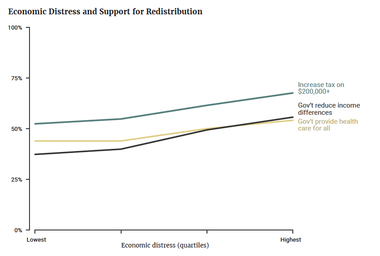
The existence of more liberal political attitudes among the economically distressed is not just a consequence of economic distress being more concentrated among racial and ethnic minorities. The same relationships are present among white people. For example, 51 percent of white people who express a great deal of economic distress favor government redistribution, compared to 35 percent who express little distress.
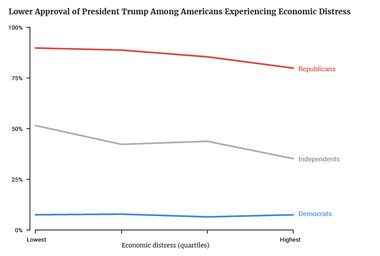
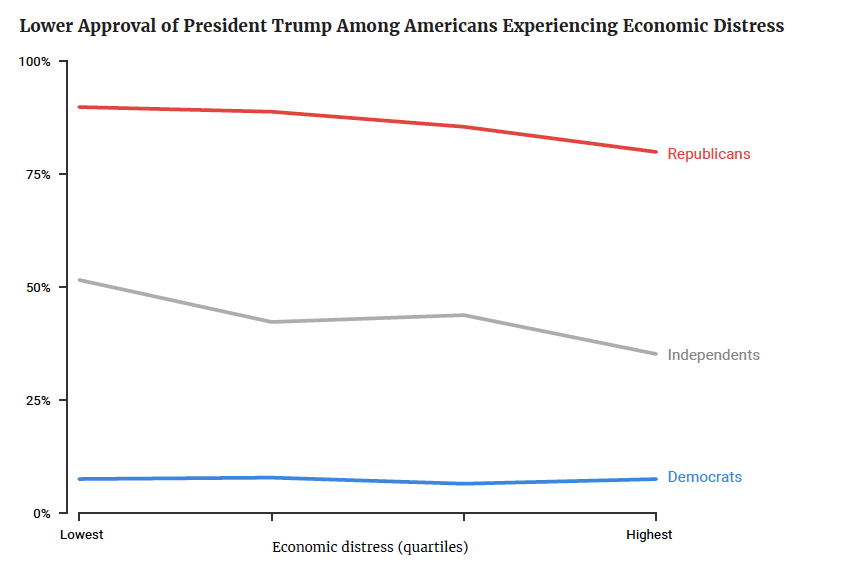
Our findings already question the commonplace assumption that Trump supporters in the 2016 presidential election exhibited particularly high levels of economic distress. Now that Trump is president, the relationship is actually reversed: Those experiencing more economic distress report less support for Trump (Figure 10).
Naturally, the primary correlate of Trump support — measured here as job approval — is partisanship. Most Democrats do not support Trump, regardless of their level of economic distress. Similarly, most Republicans (approximately 86 percent) approve of Trump no matter their level of economic distress. Nevertheless, a shift from the lowest to highest quartile of economic distress is still associated with a 10-percentage-point drop in Trump approval among Republicans.
Among independents, there is a much larger difference. About 52 percent of those experiencing relatively little distress approve of Trump. Among those experiencing relatively high levels of distress, only 35 percent approve of Trump.
Figure 10
Much commentary to date has misunderstood the political impact of economic distress. A common view is that because Trump advocates for the “forgotten men and women,” he draws inherent strength from those experiencing economic distress. But instead, economic distress appears to do what weakness in the larger macro-economy typically does for an incumbent president: It serves as a referendum for those who do not have strong partisan loyalties. The more these people are struggling economically, the more they blame the president.
Despite the ongoing recovery from the Great Recession, economic distress remains a fact of life for many Americans. A great deal of reporting during and after the 2016 presidential election focused on the economic distress of some white Americans and attributed Trump’s success to that distress.
Our analysis, however, suggests that this focus was misplaced. Economic distress in the United States is more prevalent among black people and Hispanics than among white people, even white people with less formal education. Moreover, in surveys conducted both before and after the election, Trump voters did not report higher levels of distress than did Clinton supporters. Economic distress was not the central cleavage in the American electorate in 2016.
Moving forward, economic distress in the electorate will not advantage President Trump. As the incumbent president, he will — rightly or wrongly — be blamed for economic problems in the country and in Americans’ lives. President Trump is already less popular than past presidents presiding over similarly robust economies.(x) For this reason, any increase in economic distress poses a real risk to his reelection prospects as well as the prospects of other Republican candidates.


Subscribe to our mailing list for updates on new reports, survey data releases, and other upcoming events.
