
Biden's low poll numbers are exactly what we should expect
Robert Griffin, John Sides
The Washington Post July 12, 2022
Executive Branch, Race & Ethnicity, Religion, Socio-Economic

Key Findings
The unlikely and tumultuous rise of Donald Trump is one of the most incredible political events in living memory. For a man with no political experience, no military background, and almost no support from political elites to succeed in winning the primary of a major political party and then the general election nearly defies explanation. Explain we must, though. His ascendancy suggests that the ground has shifted under our feet and portends seismic changes to a political order that we ignore at our own peril.
In the search for an explanation, many have attempted to tell a single narrative — a story about a lone feature that explains his success throughout the election. Some, for example, say that Trump’s supporters were driven primarily by economic concerns. Others suggest that cultural concerns motivated his voters. We feel this is an approach destined for failure — it seeks monocausality in world where many, often intertwined, features are driving events and where the explanatory power of a given feature varies over time.
We have informed our analysis with those feelings in mind — allowing for as broad a set of descriptive and explanatory factors as possible and analyzing Trump’s success in the Republican primaries and general election as separate events.
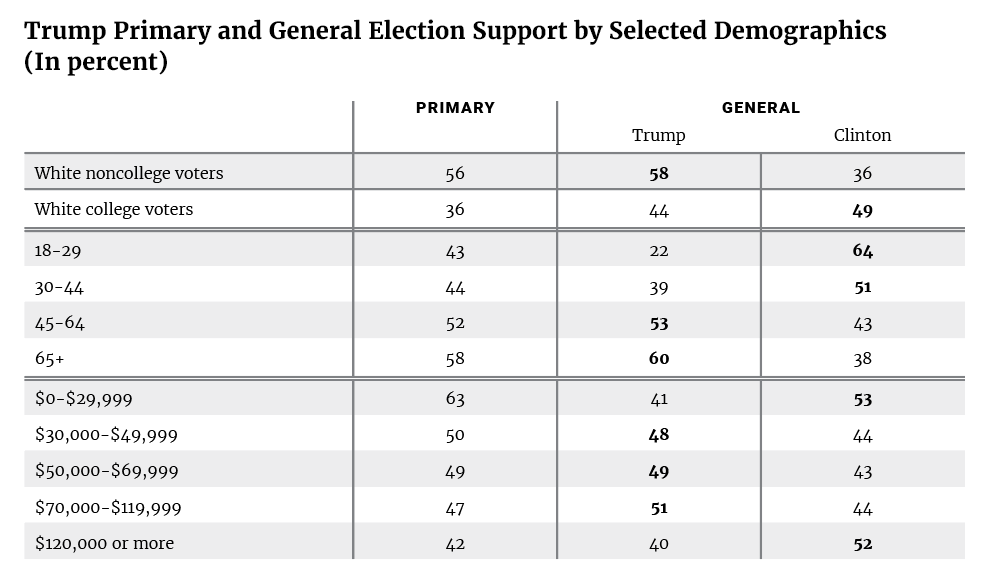
Let’s start by taking a look at a demographic breakdown of Trump’s support among various demographic groups in both the primary and general election (Table 1).
Table 1

In keeping with a variety of pre- and post-election surveys, the VOTER Survey (Views of the Electorate Research Survey) found that Trump did very well among white people without a four-year college degree — winning 56 percent of that vote in a heavily divided primary field and 58 percent in the general election.(1) By all accounts, Trump over performed among this group compared to recent Republican candidates and they play a prominent role in explaining his success in 2016.
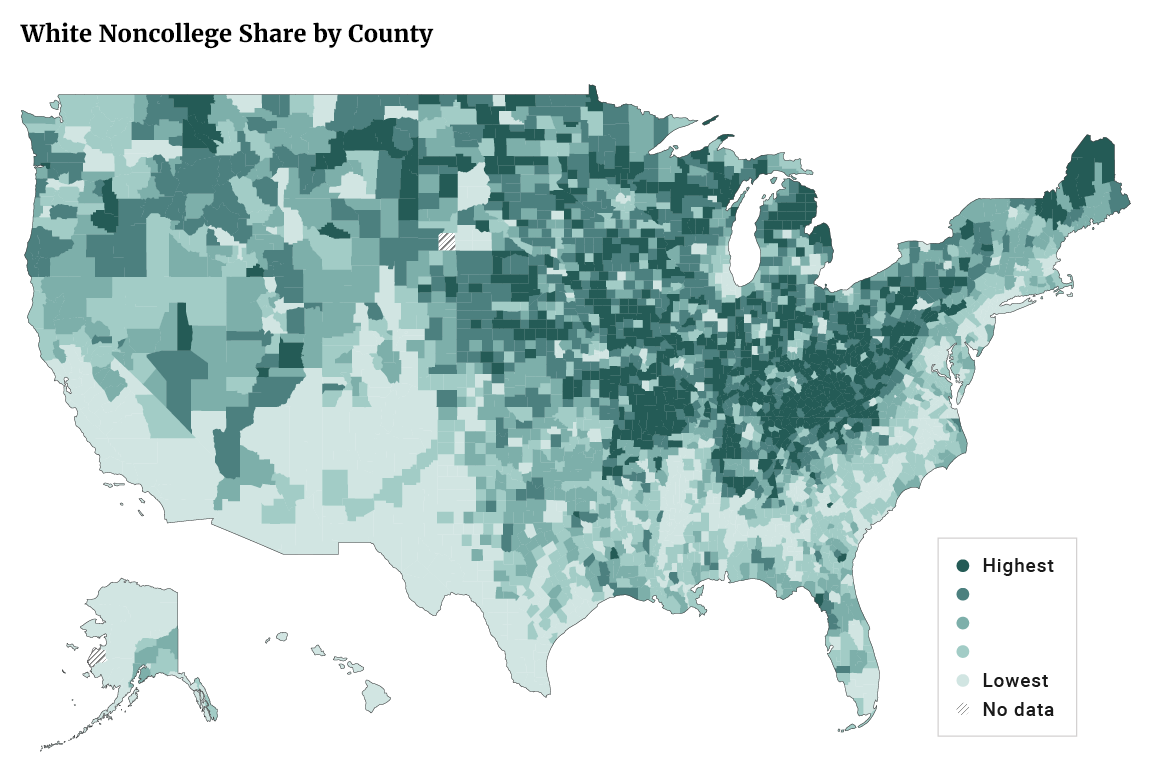
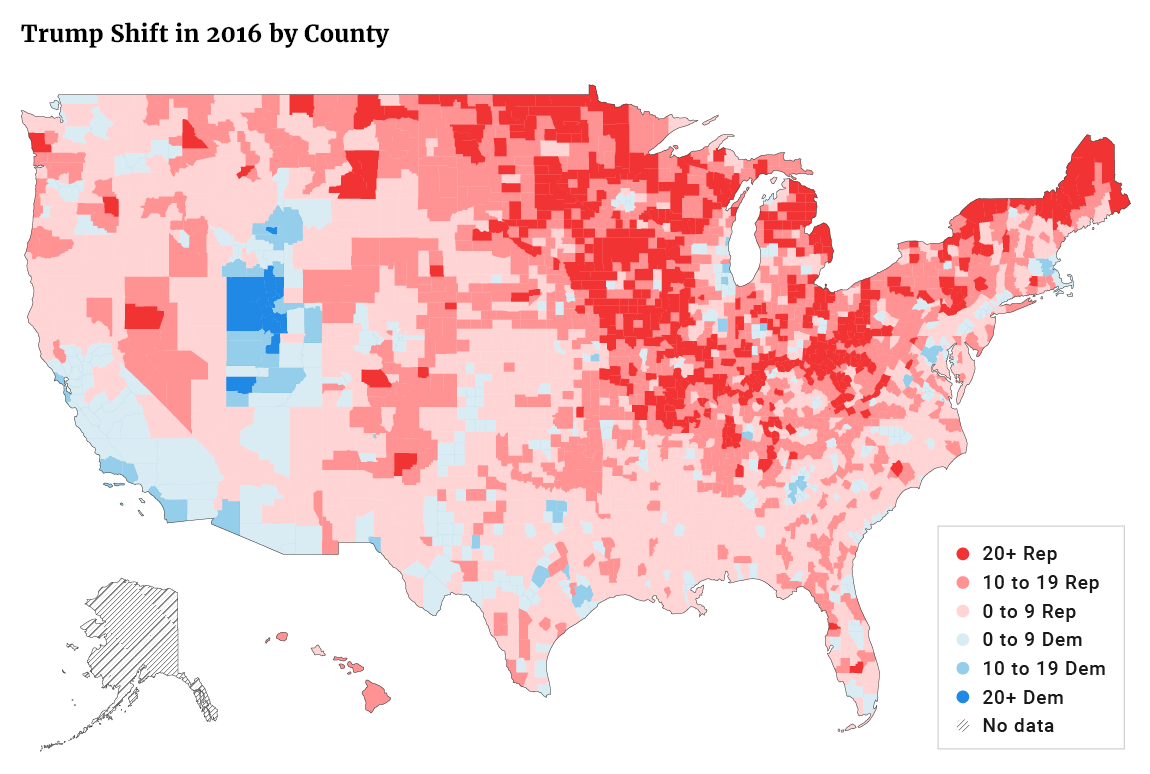
In fact, our supplementary analysis of county-level data shows that if we line up the counties with the highest percentage of white noncollege populations (Figure 1) with a map of Trump’s vote share gains relative to 2012 (Figure 2), we see a striking similarity between the two.
(1) Note that, while the general demographic patterns in VOTER survey data are similar to the exit poll figures, the specific figures differ. Generally speaking, Trump support is stronger among minorities in the VOTER Survey and weaker among white people.
Figure 1

Figure 2
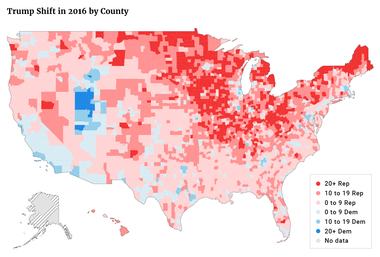
Other county-level data (not shown here) indicate that counties that swung toward Trump, besides having high levels of white noncollege voters, tend to be dependent on low-skill jobs and vulnerable to structural economic change.(i) In addition, there is strong evidence that many of these Trump-swinging counties are especially vulnerable in the sense that their inhabitants have relatively poor physical health and high mortality.(ii)
The other side of the coin is that white voters with four years college or more were a relative point of weakness for Trump; in the VOTER Survey, he won only 36 percent of this group in the primaries and lost them by about 5 points in the general election.
Reflecting these patterns, white noncollege voters made up around two-thirds of Trump’s supporters in the Republican primaries and around three-fifths in the general election. In both cases, these supporters vastly outnumbered his white college-educated supporters, consistent with the conventional portrait of his voting base.
Turning to age, Trump did notably better among voters in our older age cohorts compared to those in the two youngest age cohorts. This is, in part, a reflection of the racial makeup of these groups — the youngest voters are also the most racially diverse — and Trump’s relative weakness among nonwhite voters. It is, however, also a function of the cohort differences among white voters. This reflects a trend — in which Republican candidates win older voters, particularly older white people, while younger voters of all races have drifted toward Democratic candidates — that pre-dates Trump.
Finally, the last portion of Table 1 — which shows the breakdown of Trump’s support by income group — is notable for two reasons. First, within the confines of the primary it appears that Trump did very well with voters in households making $30,000 or less — a group that constitutes about 20 percent of the Republican primary voters in our sample.
Second, although Trump did worse with low-income voters in the general election — which once again reflects the relatively diverse racial makeup of voters in the general voter population compared to the Republican primaries — the relationship between income and vote choice was mostly flat. Along with the change in the white college and noncollege vote, this constitutes one of the bigger shifts we have seen in voting behavior. As has been well documented, higher incomes have predicted an increase in the likelihood of voting for a Republican presidential candidate for decades. This finding is consistent with the available data from the exit polls and suggests that one of the truisms of American politics has changed, at least temporarily.
In this section, we provide a descriptive portrait of the views that characterized Trump’s supporters in the VOTER Survey — in the primaries, in the general election, and among those voters that switched their allegiance from Barack Obama to Trump between 2012 and 2016. This portrait will be refined later by sorting through these views to see which of the descriptive factors enumerated here have the most robust relationships to Trump support.
Table 2 displays some characteristics of interest for Trump versus all others in the Republican primaries, Trump versus Hillary Clinton voters in the general election, and for Obama voters from 2012 who switched to Trump in 2016. Where possible, we provide the 2012 baseline measures of these characteristics to avoid the possibility that Trump supporters have changed their views to match his, rather than having them prior to his
candidacy.
The first two items in the table are feeling thermometers, where respondents rate how they feel about different groups from zero to 100 degrees, with zero the coldest and 100 the warmest possible feeling. The feeling thermometer rating for Muslims was distinctly cold among Trump supporters, a chilly 32 degrees among those who voted for him in Republican primaries, compared to 40 among those who voted for other candidates (though note that this “other” vote includes those who voted for Ted Cruz, who were nearly as cold as Trump supporters about Muslims).
The Muslim thermometer among Trump voters in the general election was similarly chilly at 34 degrees, compared to 57 among Clinton voters. And those who switched from Obama to Trump from 2012 to 2016 were only a little warmer at 39.
Table 2
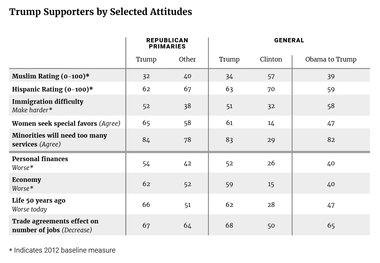
The next question in the table taps whether respondents think it should be made easier or harder for foreigners to immigrate legally into the United States. Trump supporters stood out in their preference for making immigration harder: 52 percent compared to 38 percent among supporters of other candidates in the Republican primaries and 51 percent compared to 32 percent among Clinton voters in the general election. Interestingly, the Obama to Trump switchers were even stronger in their preference for increasing the difficulty of immigration at 58 percent
Trump supporters were also quite likely to agree that “when women demand equality these days, they are actually seeking special favors.” They endorsed that view at a higher rate in the primaries, 65 percent, compared to 58 percent among other Republican candidates and by a whopping 61 percent compared to 14 percent among Clinton supporters in the general election. Obama to Trump switchers expressed a somewhat lower level of agreement than other Trump supporters at 47 percent. Other questions in the VOTER Survey that tapped attitudes toward gender roles and issues displayed roughly the same pattern across the different types of Trump and non-Trump supporters
The VOTER Survey also posed a series of questions to gauge reactions to rising diversity — in this case, to the likelihood that the country would become majority minority by the early 2040s
Trump primary supporters registered the highest level of agreement that this change would put too many demands on government services (84 percent versus 78 percent among supporters of other candidates — though again, this includes Cruz supporters who expressed about the same level of agreement). Trump voters in the general election were in the same place (83 percent agreement), far outdistancing Clinton voters who came in at only 29 percent. And 82 percent of Obama to Trump switchers agreed with this proposition, showing remarkable uniformity with the other groups of Trump supporters
Turning to economic concerns, the survey included a couple of questions that tapped short term economic pessimism: one asked respondents whether they and their family were better off, worse off, or about the same financially as they were a year previously; the other simply asked them whether they thought the economy was getting better or worse. On both these measures, Trump supporters were notably pessimistic
Among primary voters, 54 percent of Trump supporters said their finances had recently gotten worse (using the 2012 baseline measure) and 62 percent said the economy was getting worse (2012 baseline measure). This compares to 42 percent and 52 percent, respectively, among supporters of other Republican candidates
Among general election voters, Trump supporters were twice as likely as Clinton supporters to have said their personal finances were getting worse (52 to 26 percent) and four times as likely to have said the economy was getting worse (59 to 15 percent). And on both of these questions, 40 percent of Obama to Trump switchers thought things were getting worse
Long-term pessimism was also widespread among Trump supporters. Two-thirds of Trump primary supporters thought life today for people like them is worse than it was 50 years ago, compared to about half of other candidates’ supporters. The figure was similar among Trump general election supporters (62 percent compared to 28 percent among Clinton voters), and it was 47 percent among Obama to Trump switchers
Finally, Trump supporters had a jaundiced view of trade agreements. Two-thirds of Trump primary voters thought trade agreements generally decrease the number of jobs available to American workers. But then nearly as many (64 percent) of other candidates’ supporters thought the same thing. Roughly the same number of Trump general election supporters and Obama to Trump switchers thought trade agreements decrease jobs — more than the 50 percent of Clinton voters, although this difference was not as sharp as most of the other characteristics we examined
The broad picture that emerges from these data is that Trump supporters were distinctively hostile to Muslims, opposed to immigration, critical of modern feminism, worried about rising diversity, and unenthusiastic about free trade agreements. This is true of Trump primary supporters, Trump general election voters and Obama to Trump switchers
However, the attitudinal differences between Trump primary supporters and those who supported other Republican candidates were much narrower than the differences between Trump general election voters and Clinton voters (on a few questions, in fact, Cruz primary supporters looked very similar to Trump primary supporters)
The data also indicate that Trump supporters of all stripes were distinctively pessimistic on both short- and long-term economic measures. Again the differences were comparatively modest between the primary supporters of Trump and other Republican candidates and much larger between Trump and Clinton general election voters. Obama to Trump switchers were also quite pessimistic relative to Clinton voters but somewhat less pessimistic than Trump primary and general election supporters
The differences were less clear on trade issues. Trump supporters across the board were skeptical of free trade agreements, but then again so were other voters
This descriptive portrait of Trump supporters is consistent with an influential explanation for Trump’s appeal, particularly among white working class voters in communities that have seen better days. According to sociologist Arlie Hochschild,(iii) this is the “deep story” these individuals tell themselves to make sense of their world:
You are patiently standing in the middle of a long line stretching toward the horizon, where the American Dream awaits. But as you wait, you see people cutting in line ahead of you. Many of these line-cutters are black—beneficiaries of affirmative action or welfare. Some are career-driven women pushing into jobs they never had before. Then you see immigrants, Mexicans, Somalis, the Syrian refugees yet to come. As you wait in this unmoving line, you’re being asked to feel sorry for them all. You have a good heart. But who is deciding who you should feel compassion for? Then you see President Barack Hussein Obama waving the line-cutters forward. He’s on their side. In fact, isn’t he a line-cutter too? How did this fatherless black guy pay for Harvard? As you wait your turn, Obama is using the money in your pocket to help the line-cutters. He and his liberal backers have removed the shame from taking. The government has become an instrument for redistributing your money to the undeserving. It’s not your government anymore; it’s theirs.
Such a toxic interaction between economic frustration and cultural reaction would be consistent with the historical record on the rise of right populisms. As political scientists Manuel Funke, Moritz Schularick, and Christopher Trebesch have shown in an influential paper(iv) covering 140 years, 800 general elections, and 20 countries, far right populist parties driven heavily by xenophobia towards immigrants and minorities typically experience a surge in support in the aftermath of large and lingering crises. And, as economist Claudia Goldin noted in her study(v) of immigration policy debates in the U.S. in the late 1800s and early 1900s, “Almost all serious calls for the literacy test [to stem the flow immigrants] were preceded by economic downturns…and few economic downturns of the era were not accompanied by a call for [immigration] restriction in the halls of Congress.”
According to this storyline, we should see a relationship between culturally conservative views — especially those that cast immigrants and minorities as the undeserving “other” interfering with the economic mobility of white people — and Trump support. These views were activated by Trump’s candidacy that combined a direct appeal to such sentiments with an equally direct appeal to economic frustration.
In the next section, we go beyond descriptive data and explore this story further, using the unique advantages afforded by survey data.
When attempting to test stories about the rise of Trump, researchers run into an immediate problem. As counterintuitive as it may seem, there is a substantial amount of evidence that voters shift their opinions to more closely match those of their preferred candidate.
So, suppose that we find a relationship between support for Trump and a given attitude in a typical survey. We have to ask ourselves: Does this person support Trump because they had this attitude or does this person have this attitude because they support Trump? As a specific example, did Trump tap into latent racial and cultural resentments or did voters adopt some of his positions once they had decided to support him?
Luckily, the data we have collected from this project can help answer these questions. The individuals that were interviewed in the VOTER Survey weren’t just a random slice of the population — they had been interviewed in the past by the same organization that conducted the polling in 2016. Therefore, for questions asked in previous years (some of which were shown in Table 2) — years in which Trump was not yet a political figure — we can avoid some of these chicken-and-egg type problems.
These two possible scenarios — which are by no means mutually exclusive — should result in data that look quite different. If voters are merely adopting Trump’s views, than we should see a strong relationship between Trump support and respondents’ answers in 2016 but a weak or negligible relationship with their 2012 answers. If, instead, Trump has capitalized on views that already existed, then we should see similar relationships between support and their responses from both time periods.
In what follows, we look at Trump supporters in three different contexts: Trump primary supporters (which allows for some distinction between his resolute supporters and Republican identifiers who could not support Hillary Clinton); Trump general election supporters; and those who switched from voting for Obama in 2012 to Trump in 2016, a particularly important group to Trump’s electoral success. Where possible, we look at questions that were asked both in 2016 and before, but we also look at some useful questions that were only asked in 2016.
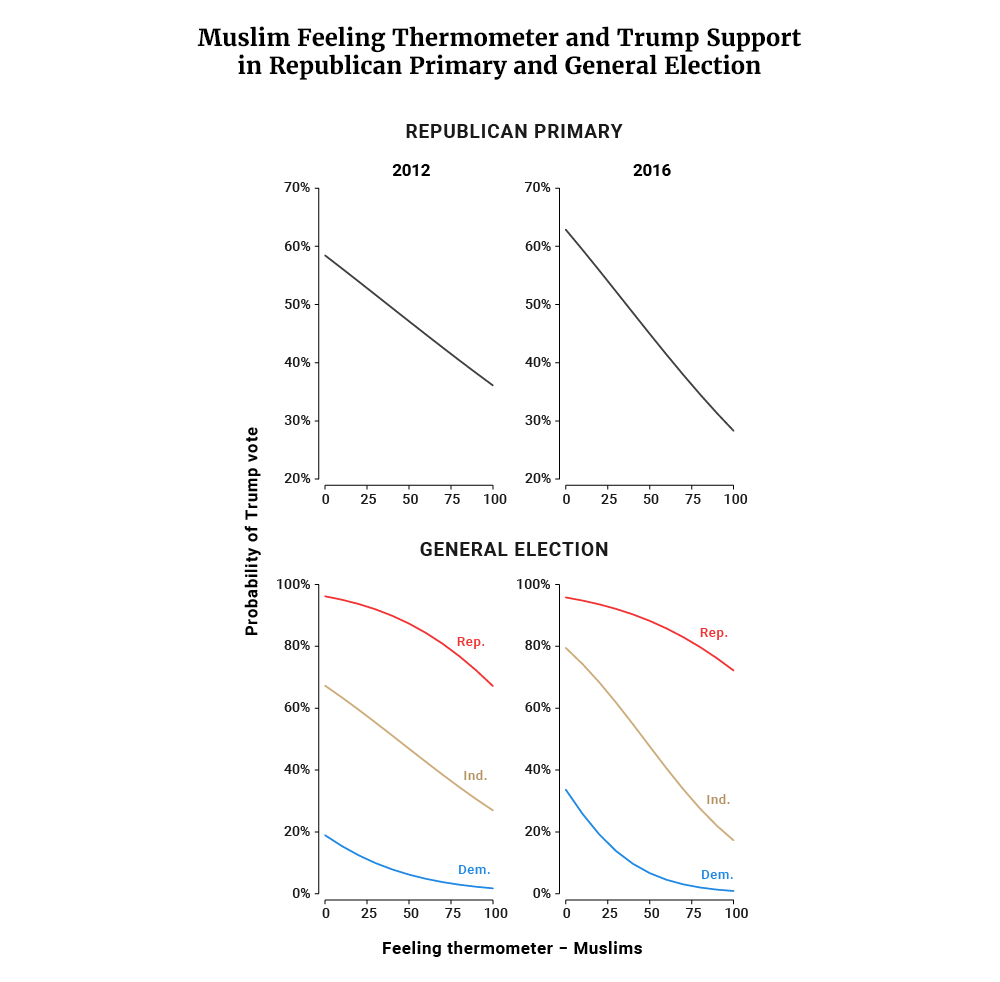
Muslims. We’ll start by looking at the thermometer question that was embedded in the survey and had also been asked in a previous survey in which the respondent had participated (2012 data were displayed in Table 2). Muslims were at the center of many of Trump’s comments and policy proposals. As shown in Figure 3, we find that negative assessments of this group in 2016 are strongly correlated with support for Trump in both the Republican primary and the general election.(2) Among those who voted in the primary, the difference in the predicted probability of a Trump vote is 20 points higher among someone who rated Muslims at 20 degrees or “fairly coldly” compared to someone who rates them 80 or “fairly warmly” in their 2016 response. Notably, we see the same strong (if slightly attenuated) relationship using the 2012 data — the exact relationship we would expect to find if Trump had tapped into pre-existing attitudes.
Figure 3
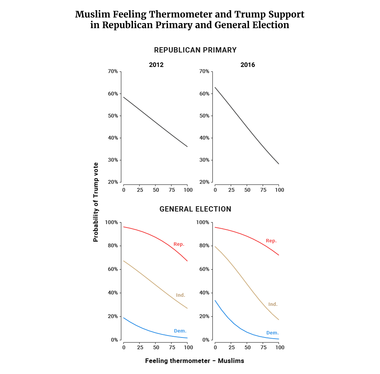
(2) These results, as well as those through the rest of the paper, were obtained using a logit model that controlled for the respondent’s age, race, education, gender, party ID, and (in the case of the primary vote) the timing of the state primary in which the respondent resides.
We see this same dynamic — generally strong relationships between Muslim ratings and Trump support with slightly smaller effect sizes using 2012 data — in our general election model. Estimates are presented separately for Republicans (red line), independents (brown), and Democrats (blue), with independents in this chart showing the strongest effects.
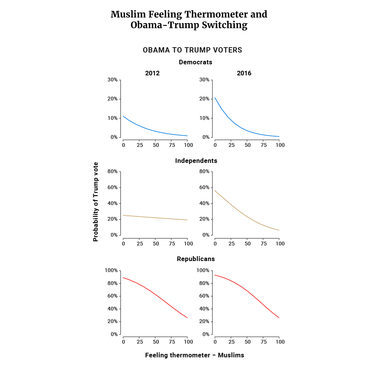
We also find that Democratic or Republican Obama voters who held colder views of Muslims in both 2012 and 2016 were more likely to vote for Trump in the general election (Figure 4). However, while we do see a relationship between the 2016 responses of independents and Trump support, this relationship is negligible and statistically insignificant using their 2012 responses — the relationship we would expect to see if independent voters shifted their opinions to match Trump’s views and policy positions.
Figure 4
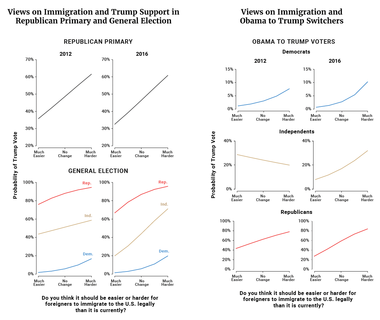
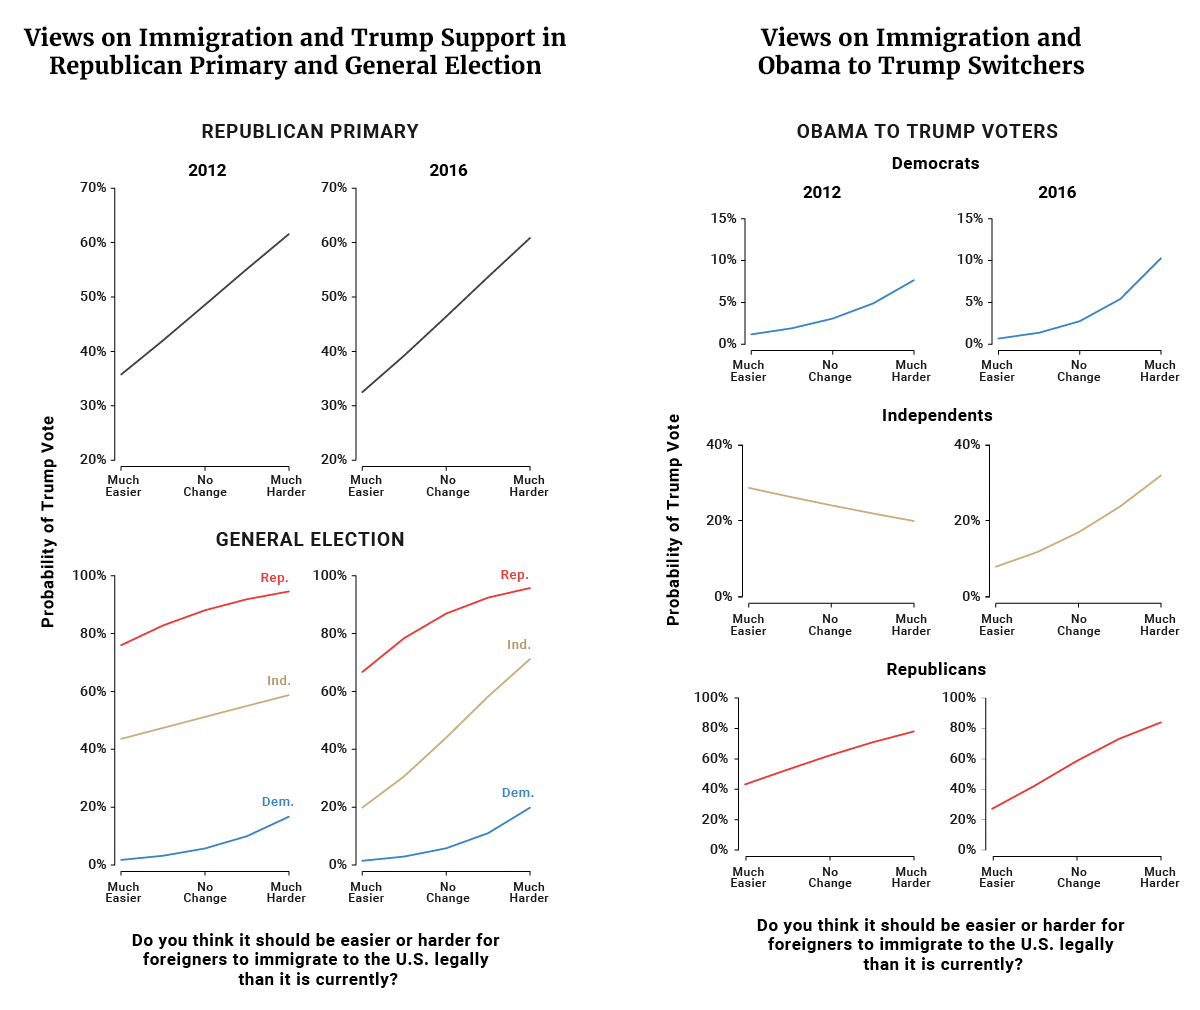
Immigration. Perhaps no single issue played as prominent a role in Trump’s campaign as immigration — a topic about which respondents were questioned in both 2012 and 2016 (The 2012 responses were displayed in Table 2). The question asked in both years was:
Do you think it should be easier or harder for foreigners to immigrate to the U.S. legally than it is currently?
Similar to the ratings of Muslims, we find that there is a strong relationship between Trump supporters and how hard they think it should be for people to immigrate to the country. Those who believed that immigration should be “much harder” in 2012 were 26 points more likely to support Trump in the Republican primary than those who thought it should be “much easier” (Figure 5). Party identifiers (Democratic or Republican) in the general election were similarly more likely to support Trump if their 2012 view was that immigration should be made much harder. However, this relationship for independents is statistically insignificant using their 2012 response — suggesting again that independents may have adopted opinions on immigration based on their support for Trump rather than the other way around.
The same dynamic holds for Obama to Trump “switchers.” Party-identifying Obama voters who wanted immigration to be much harder in 2012 were significantly more likely to switch to Trump in 2016 but this relationship was not significant for independents (Figure 6).
| Figure 5: | Figure 6: |
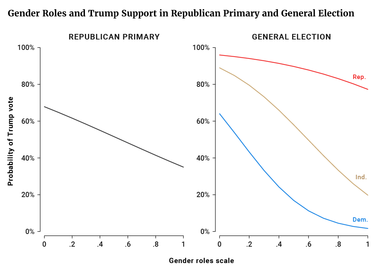
Women and gender equality. Along with immigrants and Muslims, Trump was also seen as being in conflict with many women throughout the campaign. While we don’t have measures that would capture this dimension from 2012, we believe it is still instructive to examine given the prominence of the issue. These results should naturally be taken with a heavier grain of salt given the chicken-and-egg issues discussed at the beginning of this section.
A number of questions in the VOTER Survey asked respondents for their opinions (strongly agree to strongly disagree) on statements about the role of women in society, gender equality, and gender-based discrimination (data from Question 2 were displayed in Table 2):
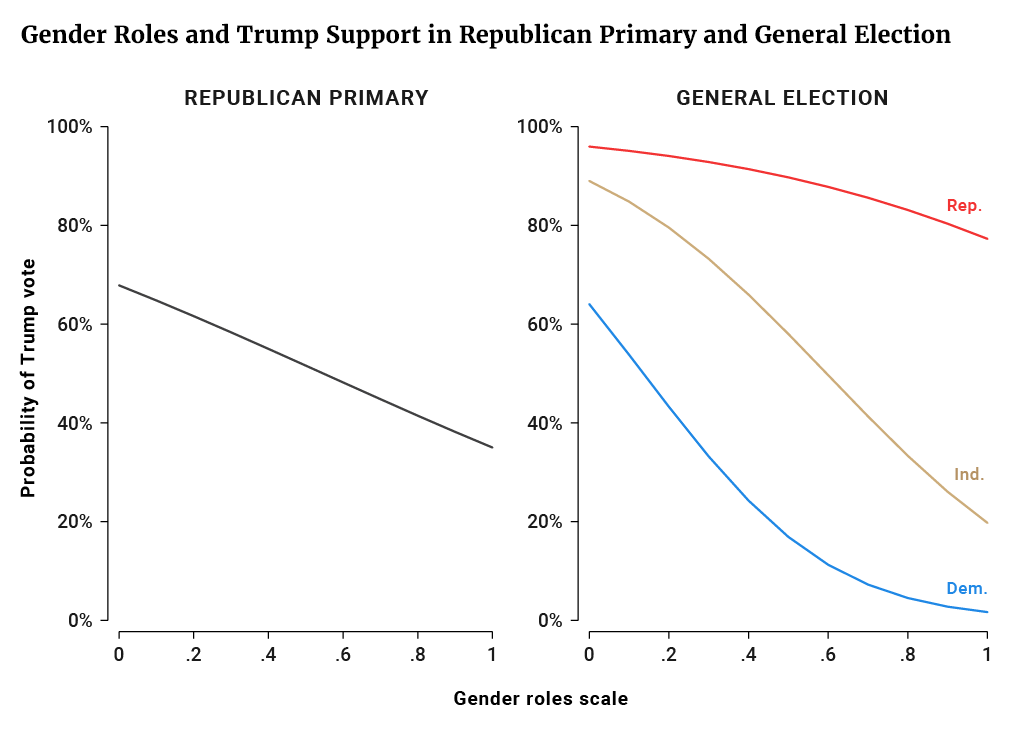
Rather than assessing these questions separately, we produced a composite variable (3) that takes information from each of the respondent’s answers to these questions. This variable is a continuous measure going from 0 to 1 where low values correlate with agreement to Questions 1, 2, 4, and 5 and disagreement to Questions 3 and 6 (i.e., a traditionalist view of women’s roles). Higher values indicate the opposite arrangement of attitudes.
In line with our previous results, Trump did better among those scoring lower (more traditionalist) on this measure in both the Republican primaries and the general election. Going from values that represent the 20th and 80th percentile of the composite variable, we see the predicted probability of Trump support drop 18 points — going from 55 to 37 percent (Figure 7). In the general election, the effect was smaller for Republicans, about equal for Democrats, and substantially larger for independents. Among Obama voters, conservative views on gender roles also promoted switching to Trump in 2016, with this effect being particularly strong for political independents (data not shown).
Figure 7
(3) We performed a factor analysis to assess whether or not these questions appeared to be probing at a single, underlying attitude regarding gender roles. There was strong evidence that this was the case, and we felt justified in the creation and use of a composite variable.
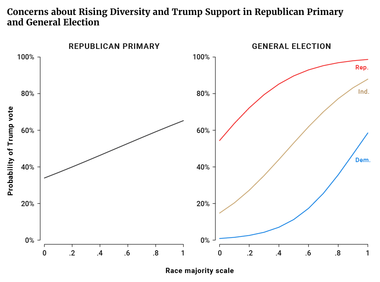
Concerns about rising diversity. Many have also posited that Trump's support was due in part to his ability to tap into white people's concerns about rising diversity. In the VOTER Survey, we prompted individuals with the following statement and four questions (data from Question 3 were displayed in Table 2):
Now, as you may know, census projections show that by 2043, black people, Latinos, Asians, and other mixed racial and ethnic groups will together be a majority of the population. Thinking about the likely impact of this coming demographic change, how much do you agree or disagree with each of these statements?
We again created a composite score — range 0 to 1 — where higher values indicate disagreement with Statements 1 and 2 and agreement with Statements 3 and 4 (greater concern about rising diversity) while low values indicate the opposite.
We find again that a measure roughly tapping into cultural reaction has a strong effect on an individual’s vote choice. Among those who voted in the Republican primary, individuals at the (relatively conservative) 80th percentile of this measure were 12 points more likely to vote for Trump than those at the (relatively liberal) 20th percentile. In the general election, this same difference generated about the same increase in the likelihood of Trump support among Democrats, a slightly greater increase among Republicans and a much sharper increase among independents (Figure 8). Obama voters also showed a significantly greater likelihood of switching their 2016 vote to Trump if they had a relatively high level of concern about rising diversity (data not shown).
Figure 8
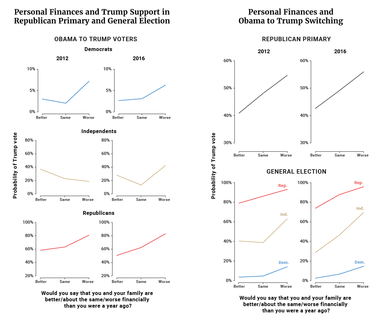
Economic concerns. Another part of the story of Trump’s rise lies in his apparent ability to tap into economic dissatisfaction and populist attitudes that have been growing in a country where wage growth has lagged, income inequality has soared, and economic mobility has slowed.
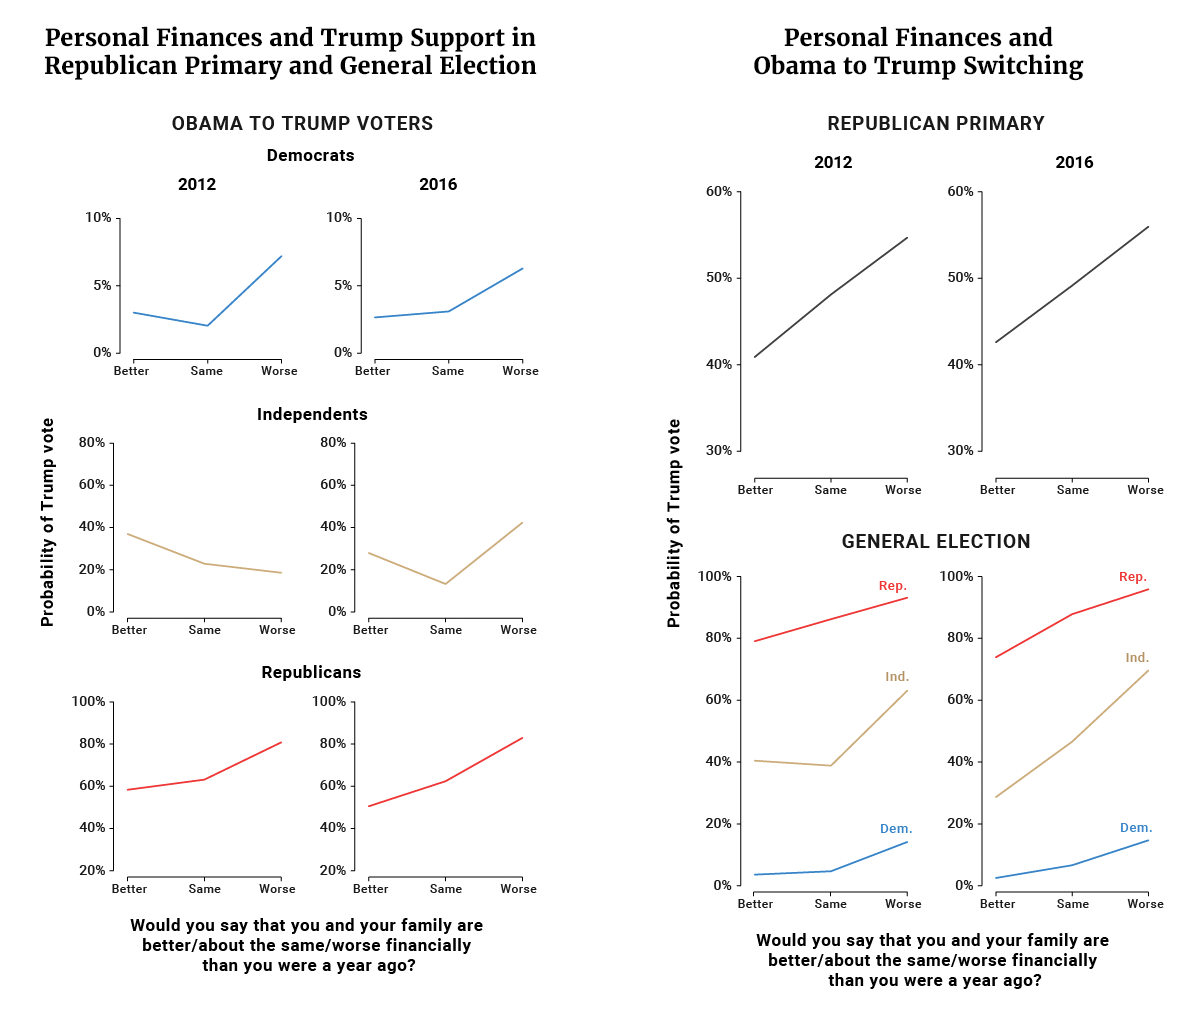
We start here by looking at each individual’s assessment of their personal finances — whether they were doing better, the same, or worse than they were one year ago. This is by no means a perfect measure of the possibly long-term economic dissatisfaction that may have promoted Trump support. In addition, this measure has a well-known tendency to be strongly related to underlying partisan predispositions rather than being a “true” measure of even current economic views. It does, however, have the virtue of having been asked in both 2016 and earlier in our dataset.
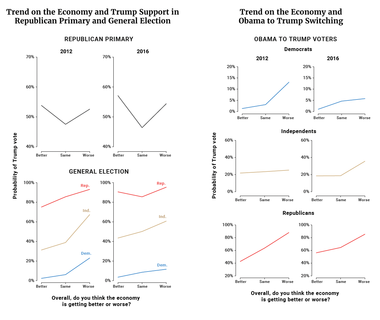
In the Republican primaries, those answering “worse” in 2012 (4) were just under 14 points more likely to support Trump (Figure 9) than those answering “better.” In the general election, Democrats, independents, and Republicans showed effects in the same general range, with independents showing the strongest effect and Democrats the weakest. Among Obama voters (Figure 10), this relationship was statistically insignificant for Republicans and independents.
(4) We continue to use 2012 data in this analysis because it is also the case that many individuals’ assessment of the economy and even their own personal fortunes are tied to political events and figures.
| Figure 9: | Figure 10: |
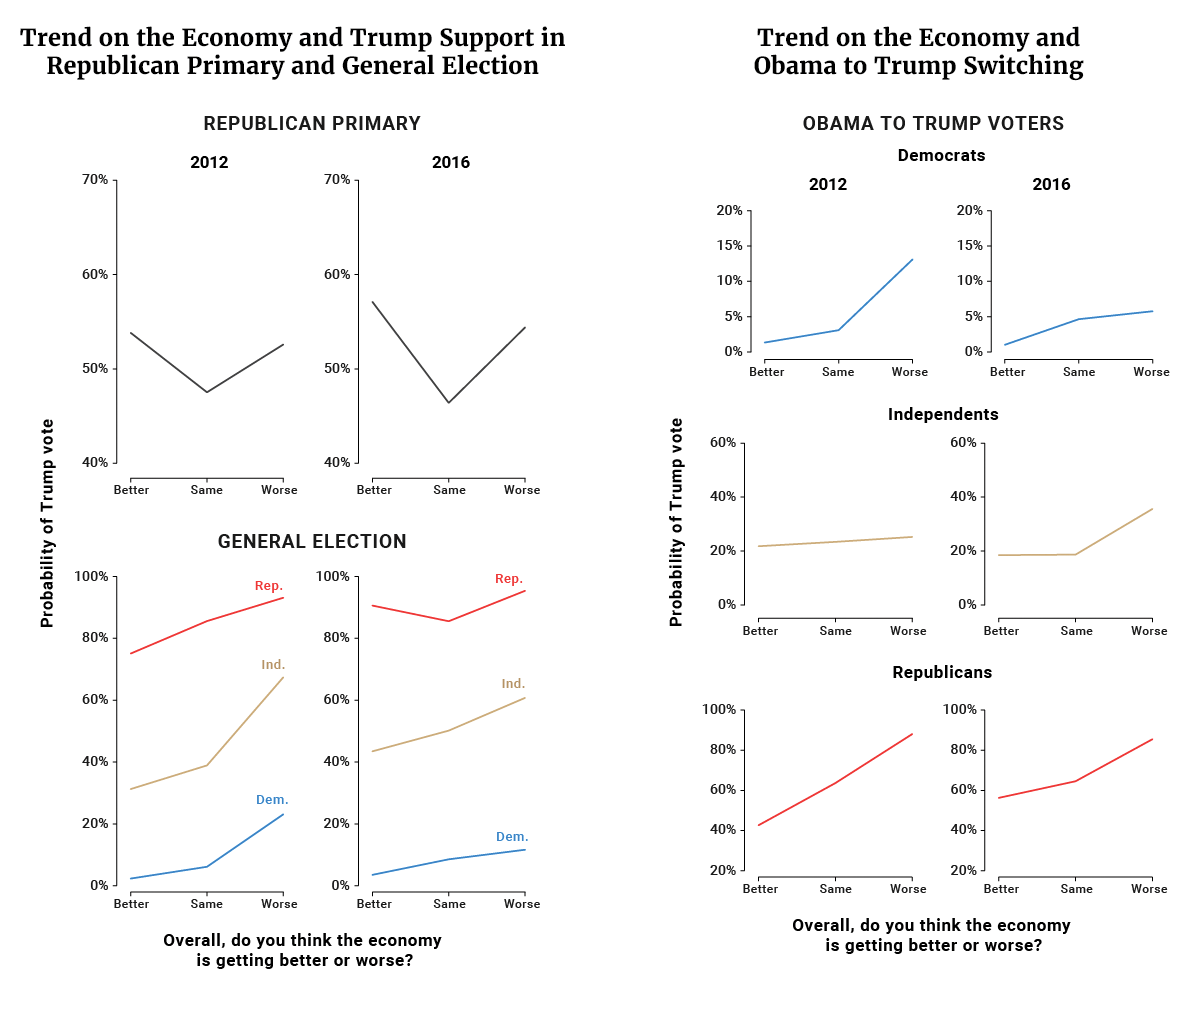
Next, we’ll examine respondents’ perceptions of the larger economy — whether they believed it was generally getting better, staying the same, or getting worse. Again, this question is not ideal for measuring economic dissatisfaction and, as with perceptions of one’s personal financial situation, is strongly related to underlying partisan predispositions. However, it was asked in both 2016 and earlier.
For the first time in our series, this measure had no discernible effect on how those participating in the Republican primary voted (Figure 11). In contrast, we can see clear relationships in the general election, where voters who rated the 2012 economy as doing “worse” were from 18 to 36 points more likely to vote for Trump, depending on their party identification.
Additionally, we see relatively strong relationships among 2012 Obama voters, especially Republican identifiers, who were significantly more likely to switch their vote to Trump in 2016 if they thought the economy was getting worse (Figure 12). Overall, this suggests that pessimism about the state of economy played a minor role in Trump’s primary successes but a substantial role in his general election win.
| Figure 11: | Figure 12: |
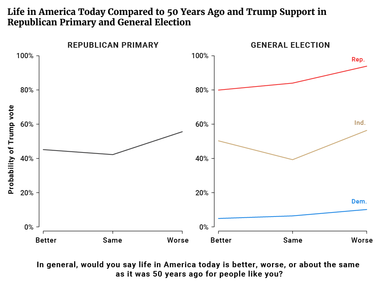
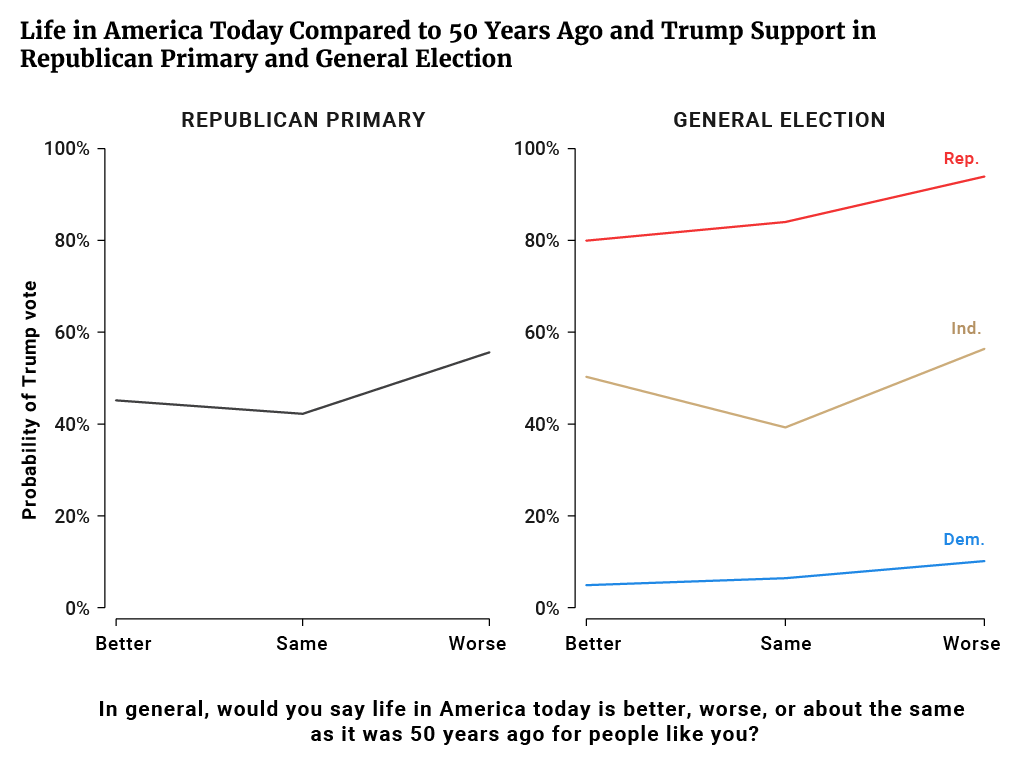
Life in America today compared to 50 years ago. Of course, short-term economic pessimism does not exhaust the ways in which Trump may have been able to tap into voters’ perception that the economic system is broken. Indeed, much of Trump’s rhetoric focused on long-term problems and the reported views of his supporters tended to dwell on economic and social problems that, in their view, had existed for quite some time.
In the survey, we asked respondents whether life in America today is worse, better, or about the same as it was 50 years ago for people like them (data for this question were displayed in Table 2). As Figure 13 shows, voters in the Republican primaries who thought life was worse today were 10 and 13 points more likely to support Trump than those who said life today was better or the same, respectively.
There was also a relationship between responses to this question and general election support for Trump though the pattern was generally weaker, except among Republican identifiers where it was fairly strong. Republican identifiers also stood out among 2012 Obama voters, where those who viewed the economy negatively were much more likely to switch their vote to Trump in 2016. Democratic identifiers and independents who voted for Obama in 2012 did not display this relationship, however (data not shown).
Figure 13
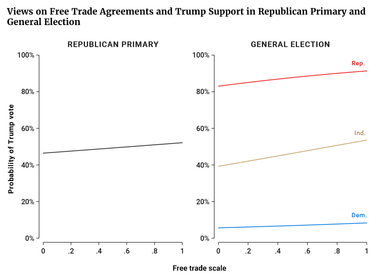
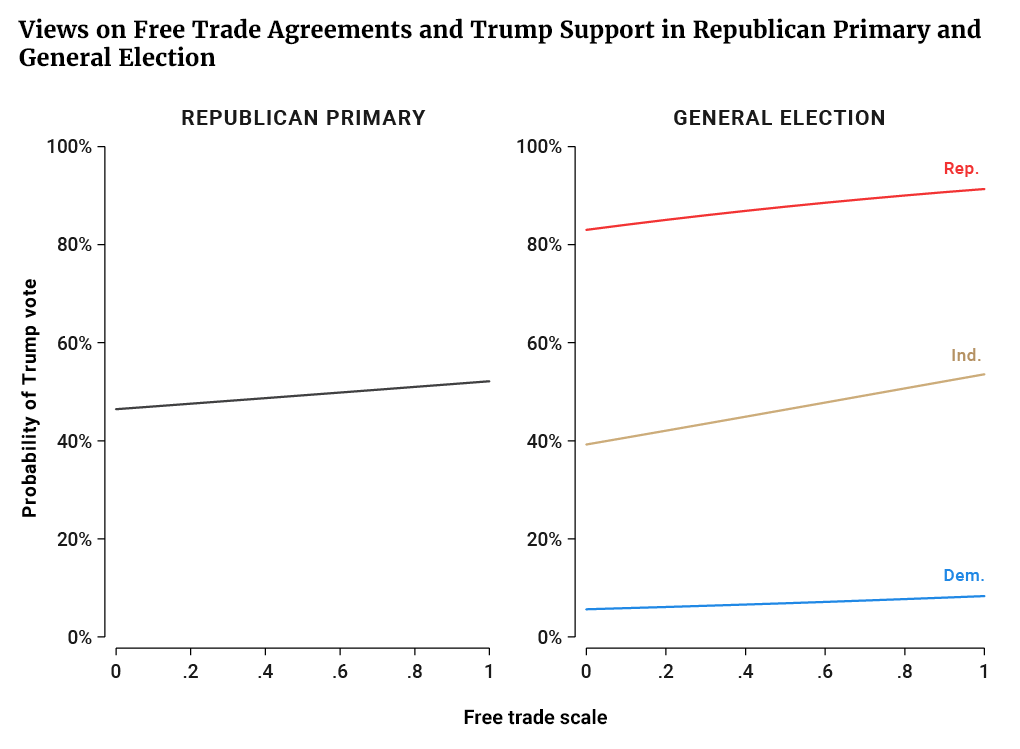
Effect of free trade agreements. It is generally assumed that, to the extent Trump benefitted from economic concerns and issues, a key role was played by his protectionist stances that placed “America First” ahead of our trading partners. In the VOTER Survey, respondents were asked to give their opinions about the impact free trade agreements would have on American workers, wages, product quality, and product sales — increase, no impact, or decrease (data from Question 1 were displayed in Table 2):
The composite variable constructed from these questions is a continuous variable where higher values correlate with a relatively skeptical attitude towards free trade agreements — in this case, being more likely to answer no impact or decrease to each of the questions above — while lower values indicate the opposite.
Despite a primary in which Trump bucked Republicans by questioning the party’s consensus on free trade and a general election in which he outflanked Clinton on trade by adopting the left’s criticisms of agreements such as NAFTA, there appears to be little relationship between voter’s skepticism of trade agreements and support for Trump. Even a movement from the 20th to 80th percentile on our free trade scale had little to no effect on respondents’ likelihood of voting for Trump in either the primary or general election (Figure 14). Similarly, among 2012 Obama voters, there was not a statistically significant relationship between free trade skepticism and switching to Trump support in 2016 (data not shown).
Figure 14
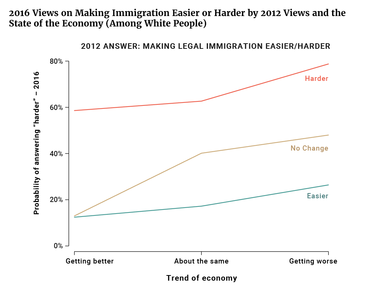
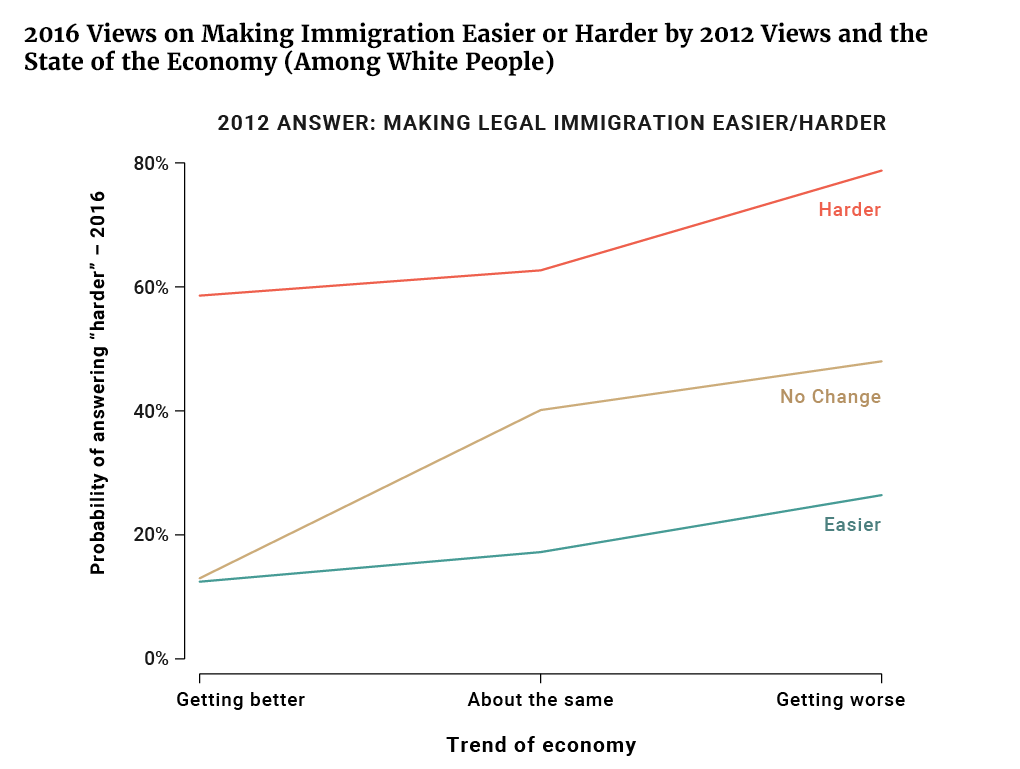
Economic concerns, cultural conservatism, and Trump support. We have shown that there are relationships between cultural conservative attitudes and Trump support and between economic concerns and Trump support. But the general thrust of the story about Trump’s rise implies that high levels of economic frustration — besides directly promoting Trump support — may have promoted it indirectly by enhancing some of the culturally conservative attitudes prominently linked to Trump’s success.
Our analysis indicates that this was the case. Specifically, those who expressed negative economic attitudes in 2012 were more likely to express key negative cultural attitudes in 2016 even taking into account their earlier answers to these same cultural questions. For example, take the immigration issue. White respondents who thought the economy was getting worse were more likely in 2016 to say immigration should be made harder, no matter what their answer was to the same question in 2012 (5) (Figure 15).
Figure 15
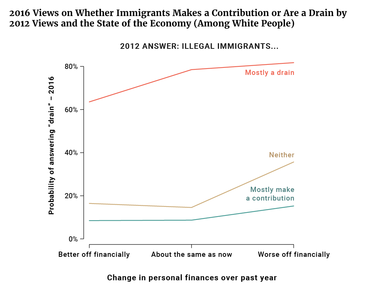
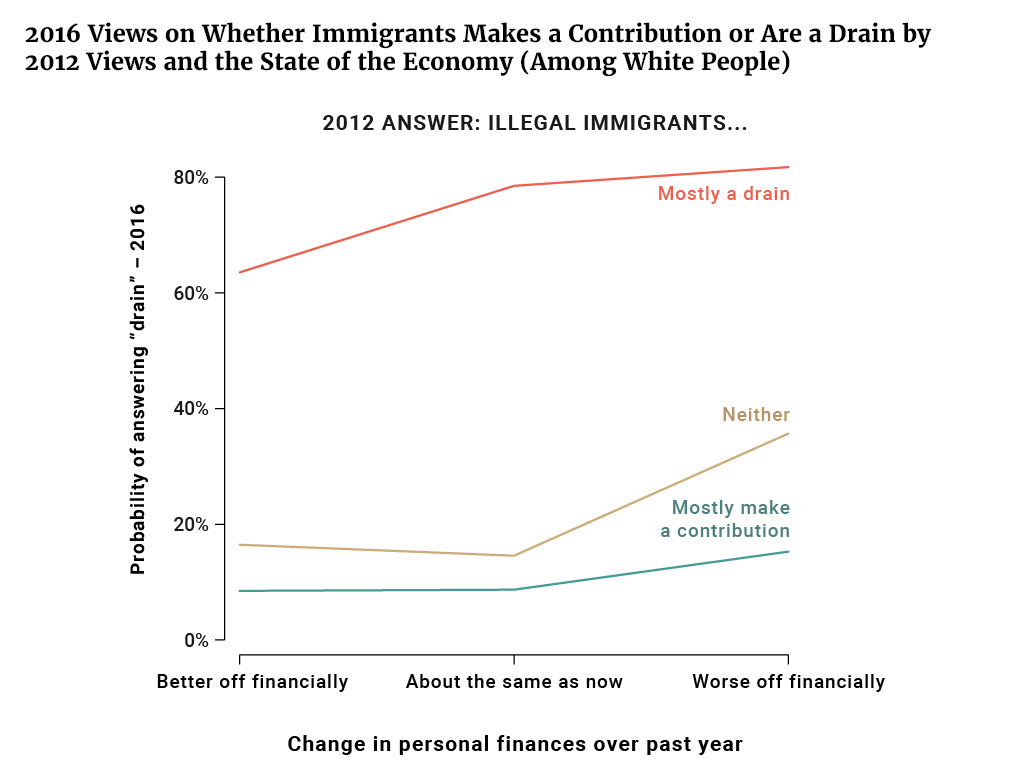
We see the same pattern for views on whether immigrants make a contribution or are mostly a drain on American society. White respondents who thought the economy was getting worse were more likely in 2016 to say immigration is a drain, no matter what their earlier answer to the question was (Figure 16).
(5) Models also controlled for age, gender, party ID, and education.
Figure 16
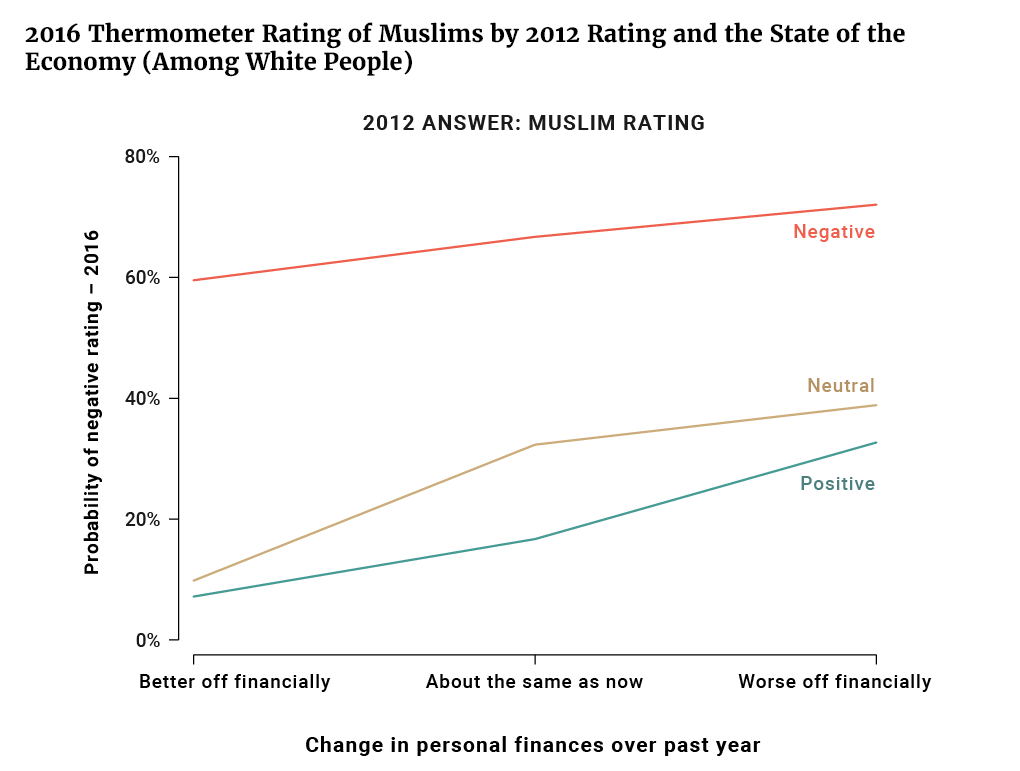
Finally, the same relationship can be detected for thermometer ratings of Muslims. White respondents who believed the economy was getting worse were more likely to rate Muslims negatively in 2016, no matter how they rated Muslims earlier (Figure 17). It is also worth noting that on all three of these items — the two immigration questions and the Muslim thermometer rating — we see the same general relationship, albeit a bit weaker, when we substitute the question on personal finances6 for the question on the state of the economy.
(6) Economic attitudes measured only in 2016 could not be used in this exercise restricting our ability to test this relationship further.
Figure 17

These findings help flesh out the basic story of Trump’s rise and his successful appeal to voters. Those who held views of immigrants, Muslims, minorities, and feminist women as the undeserving “other” were particularly susceptible to Trump’s appeal in both the primaries and the general election. In addition, economic concerns made contributions to Trump’s success, both directly and indirectly, through promoting the cultural attitudes associated with Trump support. Views on trade, however, did not appear to have much of an effect in either of these contexts.
These findings are consistent with a “deep story” that links Trump’s appeal to a complex bundle of grievances — held especially by white noncollege voters — about the impact of cultural, social, and economic change. It is clear, however, that much work remains to be done to flesh out this story. In particular, there is a need for better measures of economic concerns that are less short-term and less affected by underlying partisan predispositions. These should be combined with a thorough analysis of the community contexts of Trump support, to unpack why Trump had so much success in certain geographic areas but not in others. This will be the key to understanding the future trajectory of Trump support and right populism more generally.
About the Authors
Robert Griffin is a Senior Policy Analyst at American Progress, focusing on demographic change and American political behavior. He is the co-author and lead data analyst for the States of Change Project, a collaboration that brings together the Center for American Progress, the Bipartisan Policy Center, and demographer William Frey of the Brookings Institution.
Ruy Teixeira is a Senior Fellow at both The Century Foundation and American Progress. He is also co-director of the States of Change Project.
The views and opinions in this paper are those of the author and do not necessarily reflect the views and opinions of Democracy Fund.


Subscribe to our mailing list for updates on new reports, survey data releases, and other upcoming events.

