
The One Vital Message Democrats Need to Win
Politico September 17, 2020
Elections, Executive Branch, Ideology, Race & Ethnicity, Religion, Socio-Economic

Key Findings
The surprising rise of Donald Trump in the Republican primaries and his victory in the November 2016 presidential election defied predictions of pundits and pollsters alike. Elections observers have sought a straightforward explanation for Trump’s success, such as Rust-Belt anxieties, the plight of the white working class, racism, nativism, nationalism, authoritarianism, collective narcissism, Americanism, and so forth. Many also acknowledge that a combination of these factors may have been key.
Throughout most of the debate, however, there has been a tendency to think of Trump voters as a homogenous bloc with similar tastes and motivations. Articles with titles such as “There is No Such Thing as a Good Trump Voter” give rise to the impression that most Trump voters are driven by the same motivations and policy priorities.(i) Furthermore, the presumption has been that since Trump has belabored the immigration issue his voters must also share his immigration concerns.
Political science research has tended to use regression analysis to identify which dispositions best predict voting for Trump. These models inherently assume each Trump voter places equal weight on each policy issue measured. For example, if a model finds that immigration anxieties are highly predictive of a Trump vote, many assume this means all Trump voters are equally highly anxious about immigration. It may be, however, that some are concerned about immigration, while others are not. These models cannot distinguish between the two possibilities.
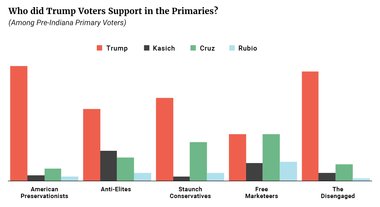
There is reason to believe that Trump voters did cast their November ballots for different reasons. The 17 candidates who competed for the Republican primary nomination remind us that when Republican primary voters had other options, many chose someone other than Trump. In the early primaries held during February and March, Trump garnered only about a third (36 percent) while a majority (64 percent) of Republican primary voters cast their ballots for Ted Cruz, Marco Rubio, John Kasich, or one of the other candidates.(1),(ii) If Trump embodied the core values and views of the Republican Party, why didn’t he win a strong majority of their votes in the early primaries?
Trump brought home most of these other Republican voters in November, garnering about 94 percent of the Republican primary voters and 79 percent of all Republicans surveyed.
But it raises questions about the composition of the Trump vote. Should it be viewed as a homogenous bloc, or perhaps more correctly as a coalition? Do Trump voters share the same set of concerns, anxieties, and motivations, or perhaps did these voters pull the lever for Trump for different reasons?
(1) Early is defined as pre-Indiana.
The December 2016 Democracy Fund VOTER Survey (Views of the Electorate Research Survey) of 8,000 respondents provides a unique opportunity to examine these voters more carefully. Statistical techniques can help us determine if Trump voters are similar or varied in their policy preferences and thus perhaps varied in their motivations. To be sure, this cannot tell us what caused someone to vote for Trump, but it can suggest if people with similar or different priorities came to vote for him. If we find that some take highly nativist positions on immigration while others do not, this undermines the theory that nativism drove all Trump voters. Even if regression models and immigration anxieties highly predict voting for Trump, this may only apply to some Trump voters, not all.
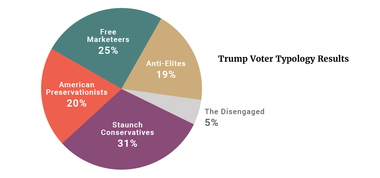
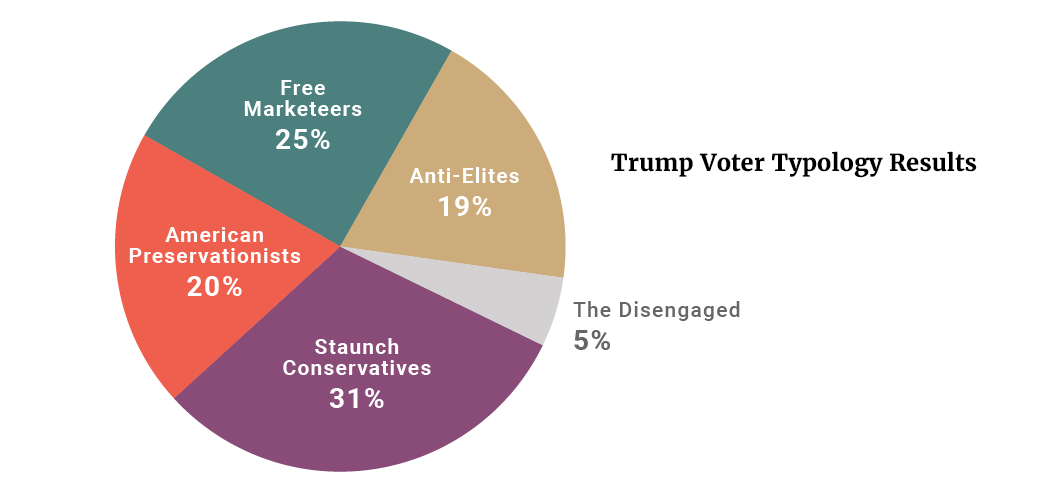
I used a statistical technique called latent class analysis to look for the existence of unique clusters of Trump voters. The results indicate that far from there being only one type of Trump voter, there were five unique clusters of them. Figure 1 displays the five groups and their share of the Trump vote: The Staunch Conservatives (31 percent), Free Marketeers (25 percent), the American Preservationists (20 percent), Anti-Elites (19 percent), and the Disengaged (5 percent). Appendix A includes detailed information on methodology.
Figure 1
Staunch Conservatives (31 percent) They are steadfast fiscal conservatives, embrace moral traditionalism, and have a moderately nativist conception of American identity and approach to immigration.
Staunch Conservatives comprise the second major tier of core Trump supporters in the Republican primaries, with Ted Cruz being their second choice. (The American Preservationists constitute the core Trump constituency.) Staunch Conservatives are the most loyal Republican voters, and they have maintained highly favorable views of Trump since the election.
Staunch Conservatives tend to be slightly older, more male than female, and upper middle class with moderate levels of education. They are the most likely group to own guns and to be NRA members. They are the most politically interested and aware group and one of the most likely groups to have correct knowledge of political facts.
While not as hardline on immigration as the American Preservationists, they are deeply skeptical of it — both legal and illegal — and worry particularly about Muslim immigration. They feel that having lived in the U.S. for most of one’s life and being Christian are very or fairly important components of being a real American. Although their attitudes toward racial minorities are similar to the attitudes of non-Trump voter groups, they are more worried that discrimination against whites is a major problem.
On economic issues, Staunch Conservatives and the Free Marketeers share an overwhelming opposition to tax hikes on the wealthy, business regulation, and government-provided health care. They have high levels of social trust in other people and worry less about whether the system is rigged. They also take conventional conservative positions on the environment and on cultural issues like same-sex marriage.
Free Marketeers (25 percent) They are small government fiscal conservatives, free traders, with moderate to liberal positions on immigration and race. Their vote was a vote primarily against Clinton and not a vote for Trump.
Although they are a loyal Republican voting group, Free Marketeers are the most skeptical of Trump. A minority voted for him in the early primaries, while Ted Cruz was their other favorite. For the general election, most say their aversion to Clinton, not support of Trump, was their true motivator.
More likely to come from the West, Free Marketeers skew male, are middle aged, and are the most educated and highly paid of the Trump groups (and non-Trump voters).
They are the most likely to be working full time, own their own homes, and have private health insurance. They are more cosmopolitan, the most likely group to know LGBT people, and they are least likely to watch TV or to smoke. Along with Staunch Conservatives, they are one of the most politically engaged and informed voter groups.
They align with Staunch Conservatives’ steadfast fiscal conservativism — except that they are even more supportive of free trade. Nearly 100 percent of them believe that the free market better solves complex economic problems than strong government. They are, however, more liberal than Anti-Elites when it comes to matters of immigration and identity. Immigration is not their priority, they have warm feelings toward immigrants, and they only tepidly support a temporary Muslim travel ban. Their own racial identity is not salient to them, and they are similar to Democrats in their warm feelings toward members of minority groups. They also reject nativist conceptions of American identity.
American Preservationists (20 percent) These Trump voters lean economically progressive, believe the economic and political systems are rigged, have nativist immigration views, and a nativist and ethnocultural conception of American identity.
Although American Preservationists are less loyal Republicans than other Trump voter groups, and nearly half had positive views of Clinton in 2012, American Preservationists comprise the core Trump constituency that propelled him to victory in the early Republican primaries.
American Preservationists have low levels of formal education and the lowest incomes of the Trump groups — and non-Trump voters as well. Despite being the most likely group to say that religion is “very important” to them, they are the least likely to attend church regularly. They are the most likely group to be on Medicaid, to report a permanent disability that prevents them from working, and to regularly smoke cigarettes. Despite watching the most TV, they are the least politically informed of the Trump groups.
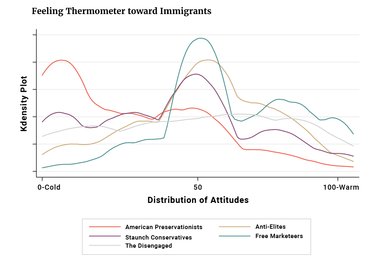
American Preservationists appear more likely to desire being around people like themselves, who have similar backgrounds and cultural experiences. They are far more likely to have a strong sense of their own racial identity and to say their Christian identity is very important to them. They take the most restrictionist approach to immigration — staunchly opposing not just illegal but legal immigration as well, and intensely supporting a temporary Muslim travel ban. They feel the greatest amount of angst over race relations: they believe that anti-white discrimination is as pervasive as other forms of discrimination, and they have cooler feelings (as measured on a feeling thermometer scale) toward minorities.(2) They agree in overwhelming numbers that real Americans need to have been born in America or have lived here most of their lives and be Christian.
American Preservationists are trade skeptics and look more like Democrats on domestic economic issues, particularly on the nation’s wealth distribution, concern over old-age entitlement programs, and animus toward Wall Street. They feel powerless against moneyed interested and the politically connected and tend to distrust other people. They also share liberals’ views on the environment, believing that global warming is a serious threat and human activity is primarily to blame.
(2) In this paper, “cool” feelings indicate the respondent rated the particular group between 0 and 48 on a scale of 0 to 100 in which 0 indicates the respondent has very cold and unfavorable feelings toward the group and 100 indicates the respondent has very warm and favorable feelings toward the group.
“Warm” feelings indicate the respondent rated the group between 52 and 100. Neutral feelings are those rated between 48 and 52, capturing the midpoint of the feeling thermometer.
Anti-Elites (19 percent) This group of Trump supporters leans economically progressive, believes the economic and political systems are rigged, and takes relatively more moderate positions on immigration, race, and American identity than American Preservationists. They are also the most likely group to favor political compromise.
Anti-Elites have relatively cooler feelings toward Donald Trump than American Preservationists, and nearly half had favorable opinions of Clinton in 2012. This group shifted most dramatically, however, against Clinton by November 2016. They were the least likely group to mobilize in the Republican primary, but of those who did, they disproportionately turned out for John Kasich.
Anti-Elites are middle-class voters with moderate levels of education, and they skew slightly younger than other Trump groups. They are the least likely group to own guns, go to church, and be politically informed.
Anti-Elites believe that moneyed and political elites take advantage of the system against ordinary people and they support increasing taxes on the wealthy. Compared to the American Preservationists, they take more moderate positions on immigration, race, American identity, religious traditionalism including gay marriage, and the environment. Why are they not Democrats? Perhaps because they take less liberal positions on legal immigration and the temporary Muslim travel ban. Democrats who moderate their positions on immigration might win over some Anti-Elite voters.
The Disengaged (5 percent) This group does not know much about politics, but what they do know is they feel detached from institutions and elites and are skeptical of immigration.
The Disengaged are less loyal Republicans who largely came to vote for Trump in the general election. They skew younger, female, and they are religiously unaffiliated. They are not very politically informed and have limited knowledge of political facts.
The Disengaged do not reveal many strong preferences on surveys, but what they do reveal is they are concerned about immigration and support the temporary Muslim travel ban. They feel unable to influence political and economic institutions and believe the system is biased against them.
There is no such thing as “one kind of Trump voter” who voted for him for one particular reason.
Figure 2
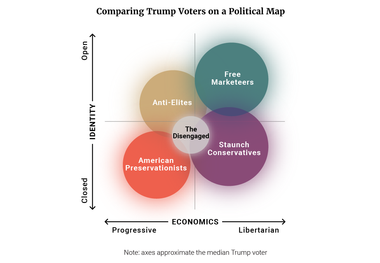
Figure 2 above provides a visual demonstration of how we can think about these Trump voting groups. The two-dimensional map shows how Trump groups compare on economics and issues of American identity including immigration. Staunch Conservatives and Free Marketeers overlap on economic issues but disagree on issues of identity. American Preservationists stand apart from Free Marketeers and Staunch Conservatives on economics but overlap more with Staunch Conservatives on matters of identity. Anti-Elites are more similar to Free Marketeers on immigration issues but are more similar with American Preservationists on economics.
Readers should know that these groupings and their percentages are not exact. There is overlap among the groups, and there is diversity even within these groups (see Appendix B). Instead, these Trump groups should be viewed as general “flavors” of Trump voters rather than precise, discrete groups of people. Nevertheless, the fact that Trump voters come with such unique combinations of attitudes suggests that Trump voters had different motivations in mind when they went to the voting booth. In short, there is no such thing as “one kind of Trump voter” who voted for him for one particular reason.
Trump voters are distinct from one another — even on the issues central to Trump’s campaign rhetoric including immigration and anti-elitism.
These particular groupings receive further support from the fact that the Pew Research Center’s 2014 Political Typology found similar groups of people. (iii) The Free Marketeers resemble Pew’s Business Conservatives, Staunch Conservatives resemble Pew’s Steadfast Conservatives, and the American Preservationists and Anti-Elites have similarities with Pew’s Hard-Pressed Skeptics. The VOTER Survey’s inclusion of many questions on immigration and race allows for further segmentation of voters.
In the next section, I profile in detail each group’s voting behavior, feelings toward political leaders, elites, and institutions, views on public policy, personal characteristics, and demographics. While there is overlap between certain groups, the results show that Trump voters are distinct from one another — even on the issues central to Trump’s campaign rhetoric including immigration and anti-elitism.
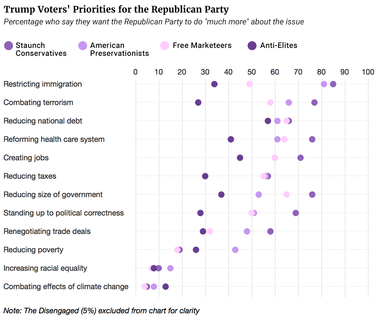
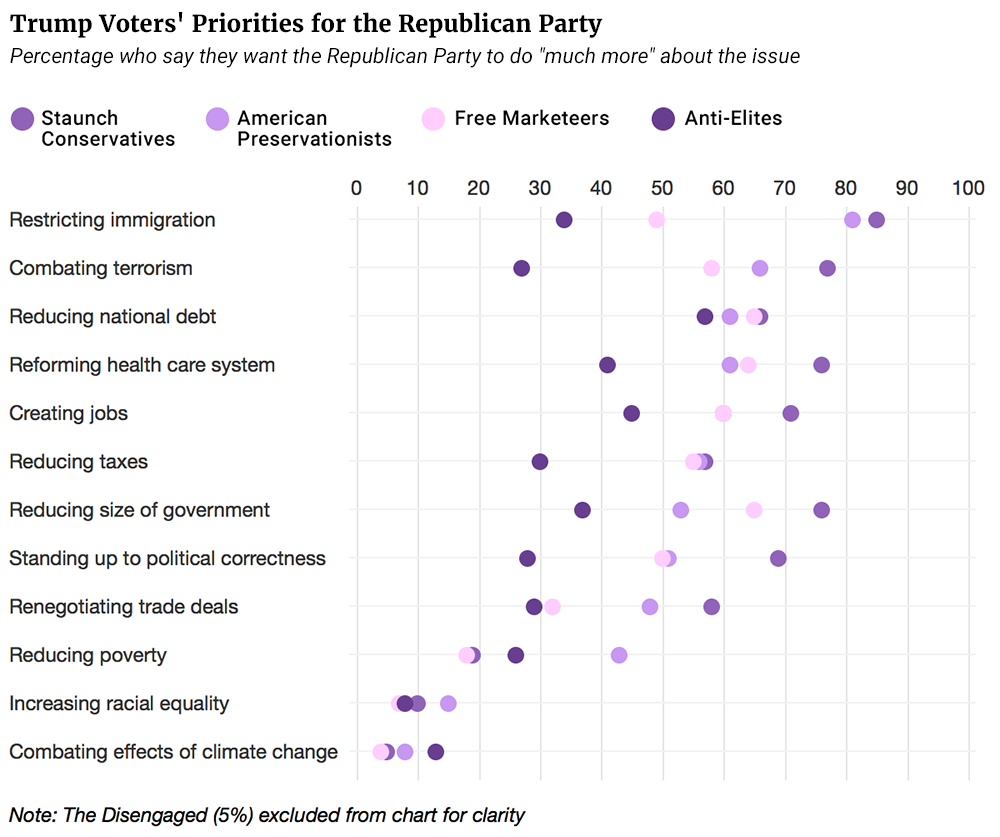
Figure 3 provides an overview of the differences and similarities across Trump voter groups in their priorities for the Republican Party. I have provided supplementary charts in Appendix C and a comprehensive comparison table in Appendix D.
Figure 3
American Preservationists (20 percent)
American Preservationists lean economically progressive and embrace a nativist conception of American identity, take nativist stances on immigration, and believe the system is biased against them.
They are a core Trump constituency with 87 percent saying their vote was for Trump and 77 percent that they have “very favorable” views of him. In the early Republican primaries, 83 percent of their votes went to Trump, more than any other cluster. They like Trump with far greater intensity than they do other Republican leaders. Only 15 percent have “very favorable” views of Ted Cruz, 17 percent for House Speaker Paul Ryan, and 12 percent for Mitt Romney. Even still, majorities have at least “somewhat” favorable views of these men.
American Preservationists comprised the core of Trump’s early primary voters, and they helped catapult him to the nomination. Among those who participated in the primary, a full 82 percent voted for Trump, a share 20 to 40 points higher than among other groups (see Appendix B).
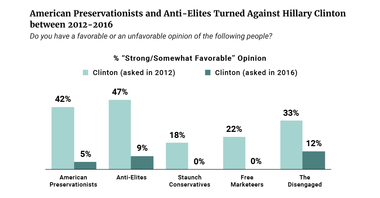
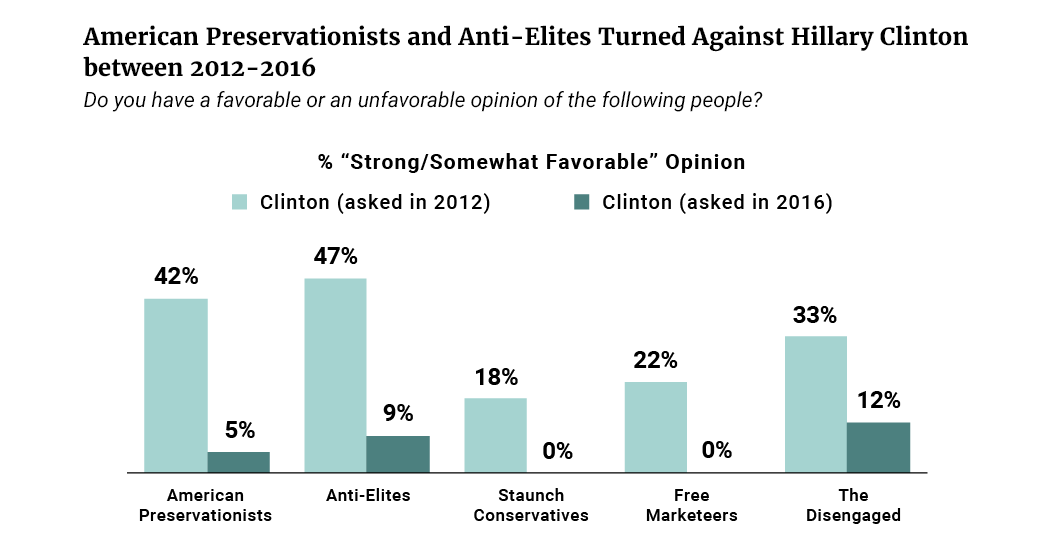
These supporters (along with the Anti-Elites) are more Democratic-friendly voters with a majority (53 percent) who say they vote for both Democrats and Republicans in elections, in contrast to the Staunch Conservatives and Free Marketeers who vote for Republicans. In 2012, 42 percent of American Preservationists had a favorable view of Clinton, but that swiftly shrank to 5 percent by 2016.
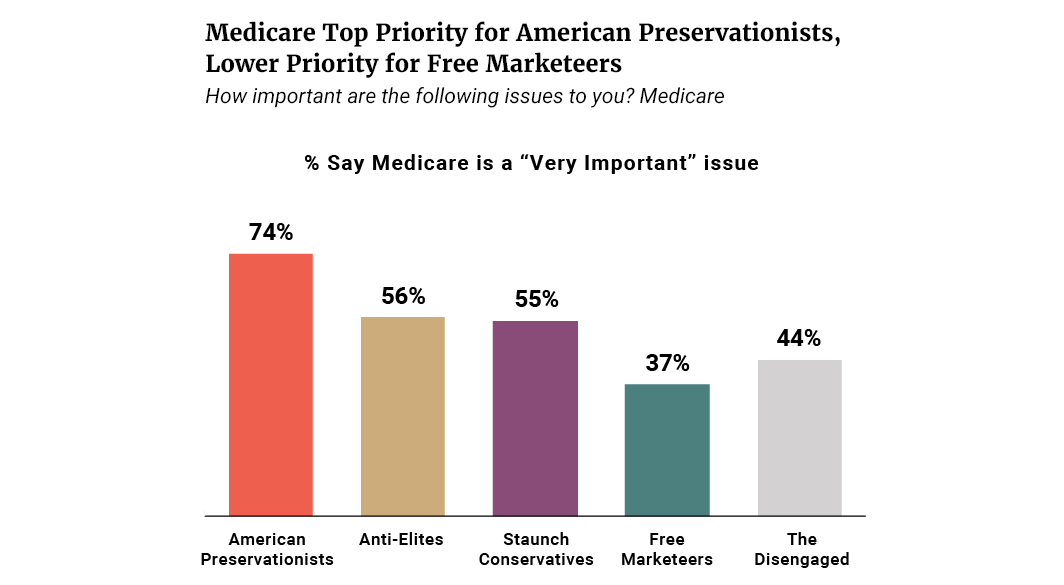
These voters are more fiscally liberal than their Free Marketeer and Staunch Conservative counterparts with 75 percent supporting higher taxes on higher income families (see Figure 4). They are also the most concerned about Social Security and Medicare of the groups (see Figure 5), and are relatively more concerned about government ensuring people have health insurance, providing family and medical leave and investing in infrastructure. Nevertheless, 8 in 10 support repealing the health care law.
Figure 4:
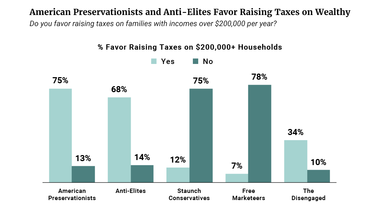
Figure 5

Figure 6

Figure 7

It is also worth noting they are the only group in which a majority (55 percent) accesses health insurance through the government — they are nearly twice as likely to do so than any other group. This cannot simply be explained by differences in age, as they are not disproportionately older than other groups. Among those under 65 years old, American Preservationists are two to seven times more likely than other groups to have government provided health insurance (44 percent).
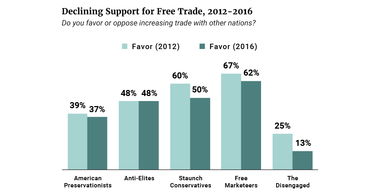
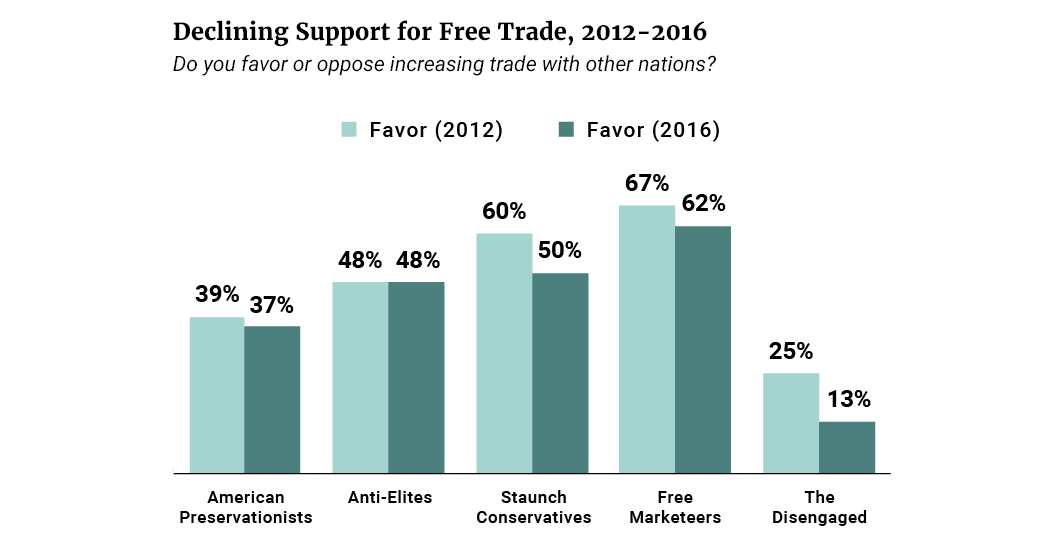
This group is also the most skeptical of free trade with only a little over a third favoring increasing trade and a plurality (47 percent) believing that trade increases the prices of products — twice the share of the other groups.
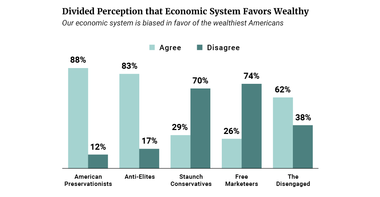
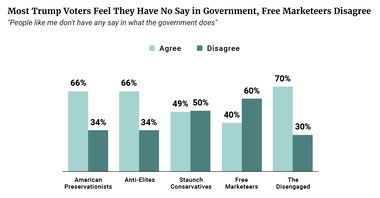
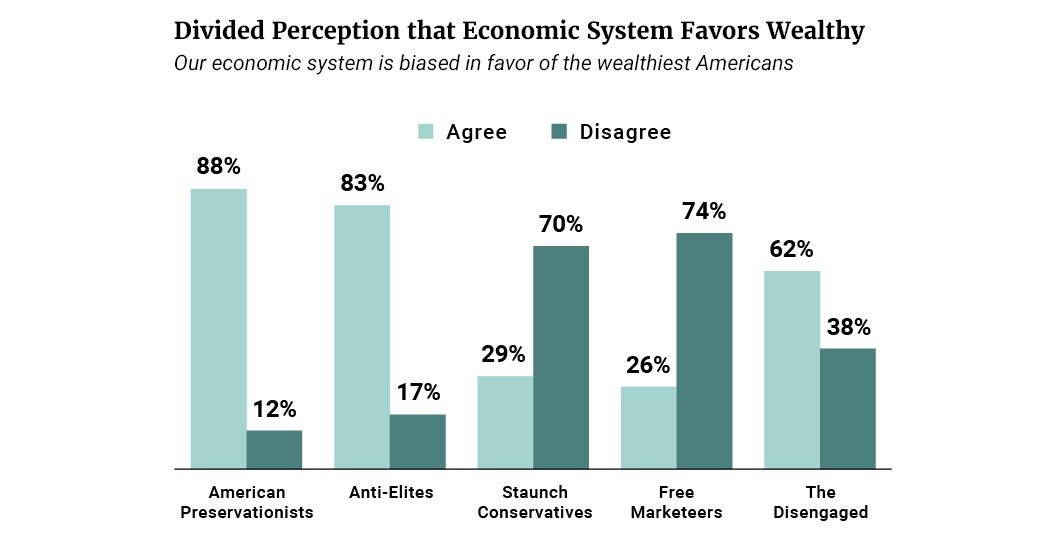
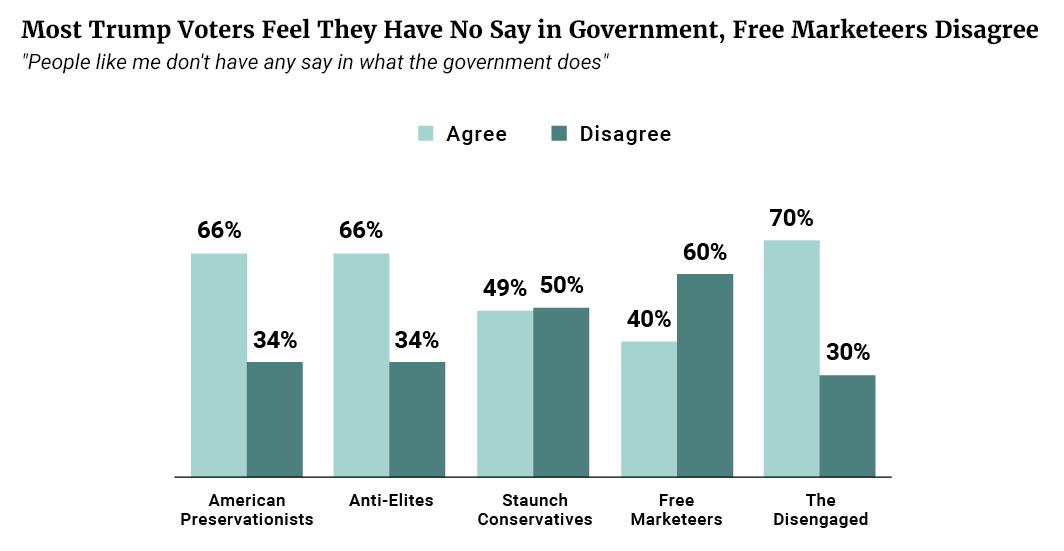
American Preservationists feel a lack of personal agency and have a sense that we are living in a dog-eat-dog world. They are the most likely group to believe the economic and political systems are rigged against them. Eighty-eight percent (88 percent) believe the economic system is biased in favor of the wealthiest Americans, 60 percent believe wealth is unfairly distributed, and 63 percent have cold feelings toward Wall Street. Furthermore, two-thirds of American Preservationists believe people like them have no say in government and they are twice as likely as other groups to think elections do not change things.
They, along with the Anti-Elites, are also most likely to believe that women miss out on good jobs because of discrimination (59 percent). This group is also the most likely to believe that most people look out just for themselves rather than try to help others (62 percent) and will try to take advantage if they get the chance (66 percent).
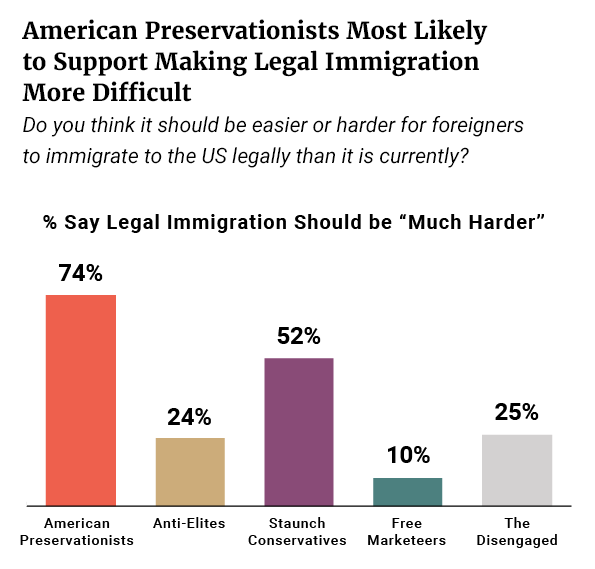
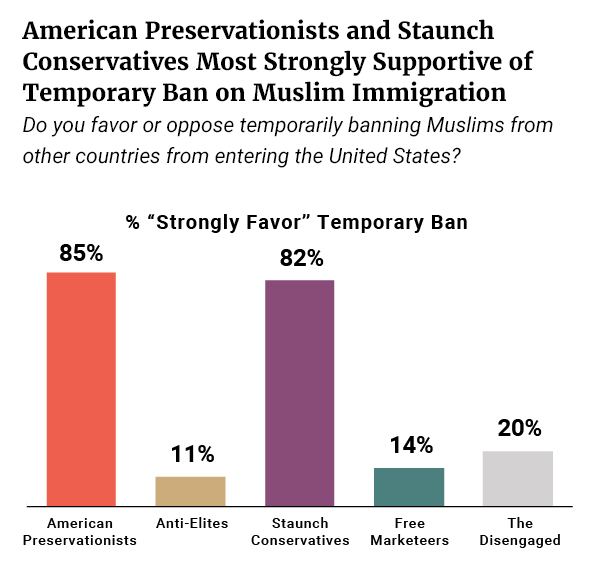
This is the core nativist group in the Trump coalition. At first glance they are similar to the Staunch Conservatives with 8 in 10 saying immigration is “very important” and roughly three-fourths opposing a pathway to citizenship for unauthorized immigrants. They are, however, the most likely group (74 percent) to say that we should make it “much harder” for immigrants to legally immigrate to the U.S. (see Figure 6). Furthermore, they are the only group in which a majority (52 percent) have very cold feelings toward immigrants overall. More than 8 in 10 also “strongly favor” the temporary ban on Muslim immigration and two-thirds have very cold feelings toward Muslims (see Figure 7).
Figure 8

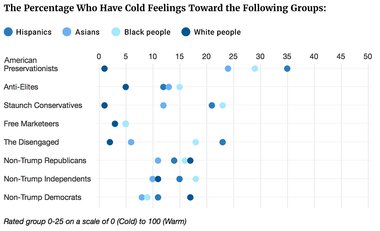
On matters of race, this group feels cooler toward Latinos than other groups. Less than half (46 percent) report warm feelings toward them, compared to 58 percent who hold similar feelings about Asians and 52 percent who have warm feelings toward African-Americans. Overall, American Preservationists are about 10 to 20 points less likely than other Trump and non-Trump groups to have warm feelings toward minority groups. A slim majority (54 percent) “strongly” believe discrimination against whites has become “as big of a problem” as discrimination against minorities. In addition, less than half agree that “increased opportunities for African-Americans have significantly improved the quality of life in the United States.”
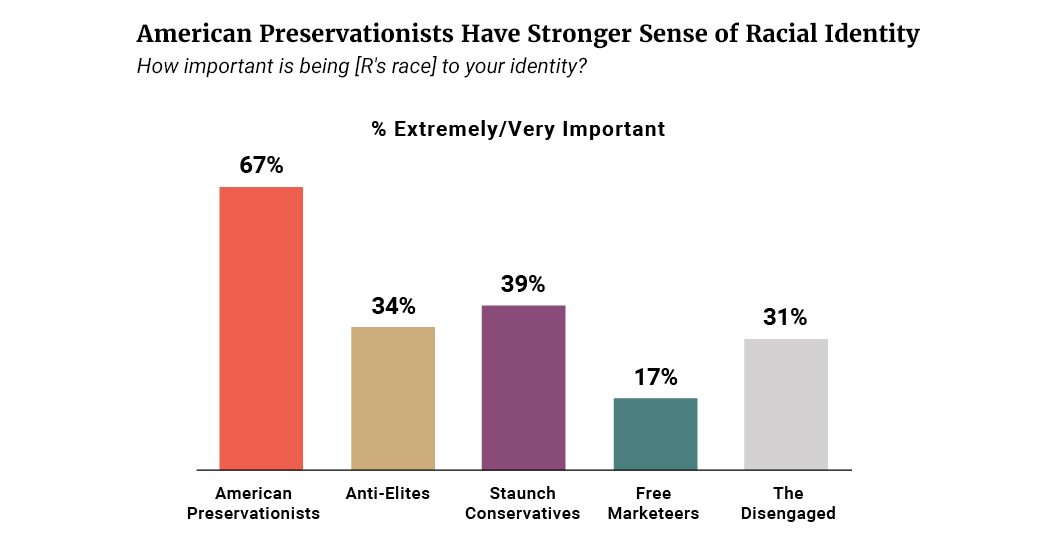
This group has a strong sense of racial identity. Fully 67 percent say that their race is extremely or very important to their identity — 30 to 50 points higher than any other Trump voter group (see Figure 8). To put this in context, only 17 percent of Free Marketeers feel their race is important to their identity. The American Preservationists were also the most likely to believe their fate was linked with their racial group (73 percent).
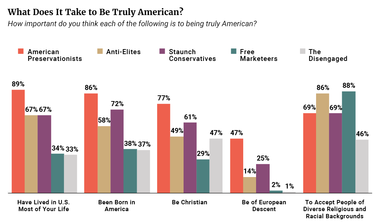
American Preservationists embrace a nativist and ethnocultural conception of American identity. They are 20 to 50 points more likely than other groups to believe that to be truly American it is “very important” to have been born in America (69 percent), to have lived in America for most of one’s life (67 percent), and to be Christian (59 percent). A plurality (47 percent) also say it is very or somewhat important to be of European descent to be truly American — dramatically higher than the 2 percent of Free Marketeers, 14 percent of Anti- Elites, 25 percent of Staunch Conservatives, and 1 percent of the Disengaged who agree (see Figure 9).
Figure 9
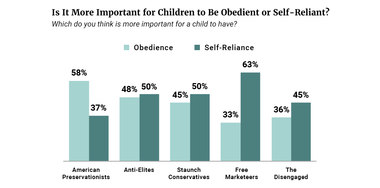
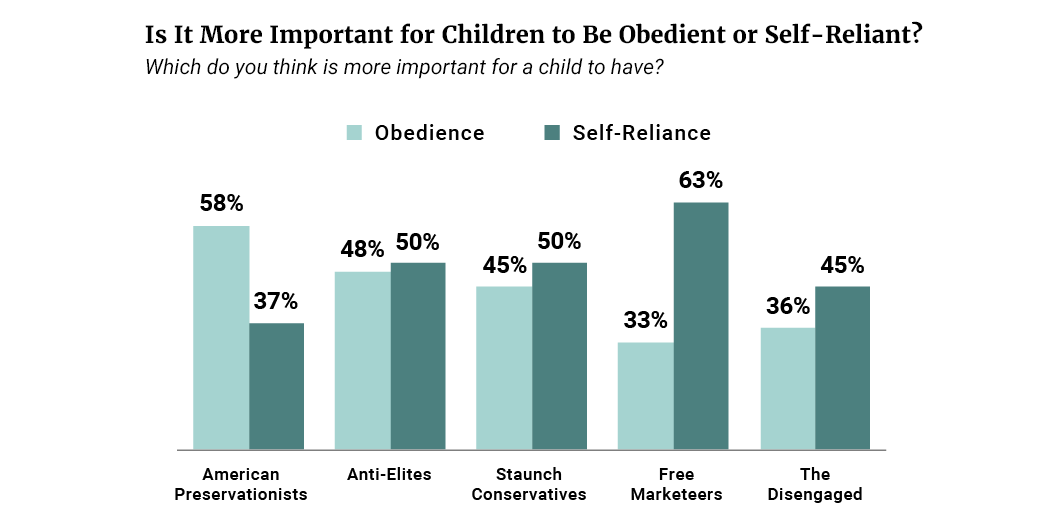
A desire for societal order and obedience is also important to American Preservationists. They are the only group to say it is more important to teach your child obedience (58 percent) than self-reliance (37 percent) (see Figure 10). They are also one of the most likely groups to say the death penalty is not used often enough (74 percent) — 20 to 30 points higher than the Free Marketeers and Anti-Elites.
Figure 10
Despite their desire for obedience from community members, they do not see themselves as traditional. A majority (57 percent) said they would not describe themselves as such, religious liberty issues were only a moderate priority, and only 33 percent described themselves as pro-life.
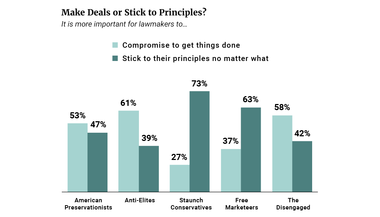
What may surprise readers is this group’s view on climate change and political compromise: they believe in both. They are one of the most likely groups to believe that global warming is happening (58 percent), that it is serious (61 percent), and caused by human activity (a 40 percent plurality). Furthermore, 53 percent want their member of Congress to be “compromise oriented” to get things done and make deals.
This group has several personal characteristics that make them stand out. They are about twice as likely as other groups to be smokers, with 42 percent who smoke every day. They are also less likely to be a gun owner or a member of the NRA.
They also watch the most TV, with 42 percent who report watching more than four hours a day. Although more in this group report watching Fox News than other cable and broadcast channels, they are less likely overall than other groups to do so. In fact, much of their TV watching is not devoted to the news. They report paying less attention to the news than other groups — they are about 20 to 30 points less likely than the Staunch Conservatives and Free Marketeers to say they know “a lot” about politics (22 percent) and follow it “most of the time” (52 percent). By extension, they have less political knowledge than other groups — for instance, they are about half as likely as the Free Marketeers and Staunch Conservatives to know that John Roberts is a “judge” (42 percent).
This is a less Republican group with only 40 percent identifying as such in 2012 and 23 percent identifying as Democrats. They are also less likely than other groups to self-identify as libertarian (6 percent), and half as likely to have been involved with the Tea Party movement (19 percent). American Preservationists and the Anti-Elites are the most likely groups to have experienced partisan shifts (+13 points) toward the Republican Party between 2012 and 2016.
Demographically, the group is less likely to have graduated from college — only 15 percent have done so. Instead, 61 percent have high school diplomas or less (20 percent say they did not finish high school). They are half as likely as other groups to be employed full time and are the most likely group to be underemployed (35 percent) with 19 percent reporting being unable to work due to a disability. They are also lower income and the most likely group to have incomes below $50,000 a year (56 percent). These differences cannot simply be explained by differences in age. They were not particularly older or younger than other groups, being about as likely as the Staunch Conservatives to be over age 55 (56 percent).
This group is more likely than others to self-identify as a “born again” Christian (45 percent), and most likely to say that religion is “very important” to them (58 percent). But surprisingly, they are also the most likely group to “never” or “seldom” attend church (52 percent). Religion appears to be more a part of their identity rather than their daily life.
Anti-Elites (19 percent)
Anti-Elites constitute a large share of voters who only voted for Trump in the general election, but did not vote in the primaries. They lean economically progressive and are relatively more moderate on immigration, but are staunchly anti-elite.
The Anti-Elites are the least loyal Republicans of the Trump voters with nearly two-thirds (63 percent) who say they vote both for Democrats and Republicans in elections, a quarter who say they voted for Barack Obama in 2012, and nearly as many who say they identify as independent (42 percent) as Republican (47 percent).
They, along with the Free Marketeers, are the weakest supporters of Trump with only 26 percent having very favorable views — 51 points lower than the American Preservationists. Four years ago, nearly twice this share (47 percent) had a favorable view of Clinton, but this number plummeted to a dismal 9 percent by 2016 (see Figure 11). While 78 percent have an unfavorable view of Clinton today, only 47 percent felt similarly toward Obama in 2012. Had a Democrat other than Clinton been on the ticket in 2016, Anti-Elites may have split their votes for him or her over Trump. Next to Trump, Anti-Elites were most likely to have voted for John Kasich (22 percent) in the early primaries. Thus, it comes as less of a surprise that this group split on the question of whether their vote was for Trump or against Clinton.
Figure 11
Today, 40 percent say they have favorable views of democratic socialist Senator Bernie Sanders. Might Sanders have peeled these voters away from Trump had he been the Democratic nominee? Possibly. Only 16 percent, however, say they would have voted for Sanders over Trump.
One might not have expected the Anti-Elites to vote for Trump given their split favorability toward him and moderate views on immigration. Furthermore, they lean more economically progressive and are less traditionalist in their policy preferences than most Republicans.
They align with the Trump message, however, with their staunch distrust of elites and a perception that the system is rigged against them. They also take less liberal positions on immigration than Democrats.
Similar to American Preservationists, they feel that there are many forces beyond their control adversely affecting their lives. A full 83 percent think that the economic system is biased in favor of the wealthiest Americans (see Figure 12), and only 24 percent think money and wealth is distributed fairly. Two-thirds (66 percent) think that people like them have no say in government and are relatively more likely to feel elections cannot change things.
Figure 12
They also align with the American Preservationists by leaning more economically progressive. More than two-thirds (68 percent) favor raising taxes on high-income households, and are about 40 points less likely than Free Marketeers and Staunch Conservatives to think there is too much government regulation of business. Compared to the other groups, they are more likely to think government should ensure that everyone has health insurance, invest more in infrastructure, and provide paid leave. They were also less likely to say the health care law should be repealed, but still two-thirds favor doing so.
They are cautious supporters of free trade, falling in between the American Preservationists and Free Marketeers. A plurality (48 percent)are aware that trade agreements generally lower prices. Similarly, a plurality (48 percent) support increased trade with other nations — views virtually unchanged since 2012. Although other Trump clusters’ support for trade declined over the course of the campaign, the Anti-Elites did not change their views.
They also take a more liberal view of the environment. Roughly two-thirds (64 percent) say that global warming is happening and that it is a serious problem (67 percent), and a plurality think human activities cause it.
They diverge from the American Preservationists and align more closely with the Free Marketeers when it comes to immigration and race. Only 39 percent say immigration is a “very important” issue and a plurality (45 percent) support a pathway to citizenship for unauthorized immigrants. Nevertheless, a majority (albeit far less than the American Preservationists) think we should make legal immigration harder (57 percent).
Anti-Elites are also far less supportive of a temporary ban on Muslim immigration being 74 points less likely than American Preservationists to favor such a policy “strongly” (11 percent versus 85 percent). Nevertheless, a majority (61 percent) at least somewhat support the temporary ban. They also feel relatively warmer toward Muslims, although only 28 percent do so.
Despite more moderate views on immigration, Anti-Elites modestly embrace a nativistic concept of American identity. Nevertheless, they are 40 points less likely than American Preservationists to say that it is “very important” to have been born in America (32 percent), to have lived in America most of one’s life (29 percent), or be Christian (28 percent) to be truly American. Ultimately, majorities say it is at least “somewhat” important for a person to have been born in America (58 percent) or at least have lived in the country for most of one’s life (67 percent) — slightly higher than non-Trump voters (see Figure 9).
Anti-Elites reject ethnonationalistic conceptions, with 77 percent opposing the idea that European heritage should be a prerequisite for being American. Instead, they strongly endorse the view that being American means accepting people of different racial and religious backgrounds (86 percent) — a number nearly identical to Free Marketeers and non-Trump voters.
It follows that they also solidly report warm feelings toward Latinos (67 percent), Asians (70 percent), and African-Americans (70 percent) — shares similar to non-Trump voters. Their own racial heritage is also far less relevant to their identity, being half as likely as American Preservationists to say it is extremely or very important to them (34 percent).
A majority (56 percent) eschew the “traditional” label. They are the most liberal on same-sex marriage of the five groups, and only 40 percent view themselves as pro-life.
They are one of the least politically engaged Trump voting groups. Only 19 percent say they know “a lot” about politics and less than half (41 percent) say they follow the news “most of the time.” By extension, they have lower levels of political information. For instance, they are the least likely group to know that Nancy Pelosi is a member of the House of Representatives. Given their lower level of political engagement, it is possible the Anti-Elites were less likely to follow and thus be less aware of the pattern of inflammatory comments and missteps Trump made along the way.
Like the American Preservationist cluster, many Anti-Elites are former Democrats and independents. In 2012, a plurality identified as independent (42 percent), 19 percent as Democratic, and only 39 percent as Republicans. American Preservationists and the Anti- Elites are the most likely groups to have experienced partisan shifts (about +10 points) toward the Republican Party between 2012 and 2016. This group is also less likely to have been involved in the Tea Party movement (11 percent) compared to other groups.
Anti-Elites do not stand out appreciably based on demographics. They have moderate incomes and levels of education, but they are slightly younger and more diverse, and they are the second most likely group to be underemployed (26 percent).
Staunch Conservatives (31 percent)
Staunch Conservatives fit a conventionally conservative mold. Even though their brand of conservativism is distinct from Trump’s, they constituted a core Trump constituency in the primaries. They prefer less government intervention in the economy, support moral traditionalism, and do not fear a rigged system. They share, however, many of the immigration concerns of the American Preservationists while lacking the zealous ethnocultural nationalism.
Eight in 10 are highly favorable toward Trump and 87 percent indicate their November vote was for Trump and not against Clinton (87 percent). They are a loyal Republican group with a majority (58 percent) saying they only vote for Republican candidates and 91 percent who cast their ballots for Romney in 2012. Their support for Trump is not exclusive, and they are solidly favorable toward other Republican leaders like Ted Cruz (74 percent) and Paul Ryan (57 percent). But a majority came to dislike Romney over the course of the campaign flipping from 69 percent favorable in 2012 to 58 percent unfavorable in 2016. They are the only Trump cluster who turned against Romney so severely. They seem to have perceived Romney’s criticisms of Trump over the course of the campaign as partisan betrayal.
Although less supportive of Trump in the primaries than the American Preservationists, 65 percent of Staunch Conservatives voted for him.
Staunch Conservatives prefer small government on fiscal matters and often are strongly at odds with American Preservationists and Anti-Elites. Three-fourths (75 percent) oppose raising taxes on higher income people and feel cool toward unions. In addition, more than 9 in 10 believe government regulation of business has become excessive, that government does not have a responsibility to ensure everyone has health insurance, that the free market can best solve economic problems, and that we ought to repeal the health care law. Further, they are about 20 to 30 points less concerned about Medicare, Social Security, and paid family and medical leave than the American Preservationists and Anti-Elites.
They are cautious free traders with twice as many supportive of increasing trade (50 percent) as opposed (26 percent). However, they have turned against trade. In 2012, 60 percent favored increasing trade agreements (see Figure 13). While they are aware of the benefits of free trade with 53 percent saying trade agreements lower prices, Trump campaign rhetoric likely influenced their views. Like their turn against Romney, no other Trump group shifted as much as the Staunch Conservatives on trade. As the most solidly Republican cluster (66 percent), it is perhaps unsurprising they would align their attitudes with the leader of the Republican Party, consistent with political science expectations.
Figure 13
Staunch Conservatives are highly skeptical of climate change, in stark contrast to the American Preservationists and Anti-Elites. Three-fourths (75 percent) say it is not happening. For those who believe temperatures are rising, a majority think natural causes are to blame.
With a strong sense of personal agency and belief in a just world, Staunch Conservatives disagree with Anti-Elites and American Preservationists about the existence of a rigged system. They solidly reject the idea that the economic system is biased in favor of the wealthy (70 percent) and overwhelmingly believe the wealth distribution is fair (88 percent). Further, 77 percent disagree that women often miss out on good jobs because of discrimination and two-thirds instead believe that men and women have equal opportunities. They also believe they have the power to impact government, with 75 percent agreeing that elections can change things. They would agree with Trump campaign manager KellyAnne Conway’s comment: “I consider myself one of those [people] who is a product of her choices, not a victim of her circumstances.”(iv)
Although Staunch Conservatives do not believe the system is rigged, they do view it as inherently more competitive and are less trusting. A slim majority (51 percent) believe people look out for themselves rather than help others, and 59 percent worry most people would take advantage of them rather than be fair.
Moral traditionalism is important to Staunch Conservatives, with a majority (54 percent) expressly embracing the traditionalist label. Seven in 10 oppose gay marriage, 56 percent call themselves “pro-life,” and 66 percent say religious liberty is “very important” to them. And although they disagree (67 percent) that women should return to traditional gender roles, they are the most likely group to say women cause more problems than they solve when they complain about harassment (66 percent).
On immigration, Staunch Conservatives often coalesce with American Preservationists, but to a slightly more moderate degree. Eight in 10 say that immigration is a “very important” issue priority, and 77 percent oppose a pathway to citizenship for the undocumented. A majority (52 percent) also say that legal immigration should be harder too, and a plurality (29 percent) feel very cold toward immigrants. They are, however, 20 points less likely than American Preservationists to feel this way.
Like the American Preservationists, 82 percent “strongly favor” temporarily banning Muslims from entering the U.S. Furthermore, 58 percent indicate very cold feelings toward Muslims. In contrast, only 14 percent of Free Marketeers and 20 percent of Anti-Elites feel similarly.
On race, Staunch Conservatives tend to fall in between Free Marketeers and American Preservationists. Majorities indicate warm feelings toward Asians (68 percent), African-Americans (59 percent), and Latinos (59 percent) which is roughly in line with non-Trump independents and Republicans. A similar share (52 percent), however, also “strongly agree” that discrimination against whites has nearly surpassed that of minorities.
Staunch Conservatives reject ethnic conceptions of American identity but tend toward a nativist view, falling in between American Preservationists and Anti-Elites. They are 20 points less likely than American Preservationists to say it is “very important” to have been born in America (47 percent), to have lived in America for most of one’s life (40 percent), or to be Christian (37 percent) to be truly American. Majorities agree, however, these attributes are at least somewhat important. Strong majorities also say it is not important to be of European descent to be truly American (72 percent) but instead believe it is important to accept people of diverse racial and religious backgrounds (69 percent) (see Figure 9).
Compromise is a road block for Staunch Conservatives. Three-fourths (73 percent) say they want their elected representatives to “stick to their principles, no matter what” while only a quarter think it is more important to compromise and make deals to “get things done.”
Several personal characteristics make Staunch Conservatives stand out. They are the most likely group to own a gun (58 percent) and a quarter are members of the NRA. They report the highest level of political engagement and awareness with 84 percent saying they follow the news “most of the time” and 56 percent saying they know “a lot” about politics. They are the most likely group to watch Fox’s programming, and they depend almost exclusively on its content for news. For instance, 57 percent reported watching The O’Reilly Factor on Fox compared to 8 percent who watch Anderson Cooper on CNN. To put this in context, only a third of American Preservationists and a fifth of Anti-Elites also watched O’Reilly. Staunch Conservatives, along with the Free Marketeers, have the most political knowledge. For instance, 72 percent correctly identified both Nancy Pelosi and John Roberts’ current jobs, double that of the American Preservationists and Disengaged.
The Staunch Conservatives are the most male group of Trump voters. They tend to have slightly less than average levels of education than all Americans, with 50 percent who are high school graduates or less and 22 percent who have graduated from college. They have about average incomes and skew slightly older with a third who are over 65 years old.
Despite their moral traditionalism, they do not stand out by way of religious attendance or affiliation. They are about as likely as other groups to identify as born again (36 percent), to say religion is “very important” (49 percent), or to attend church regularly (29 percent).
As mentioned earlier, they are the most loyal Republican group, reaching 86 percent when independent-leaning Republicans are included. They are the most likely group to identify as conservative (85 percent). They also are the most likely to say they were involved in the Tea Party movement (51 percent).
The Free Marketeers (25 percent)
The Free Marketeers are small government fiscal conservatives and free traders who take moderate to liberal positions on immigration and race, and were the most hesitant Trump voting group.
What is most peculiar about this group is that many of their policy preferences are highly at odds with both Trump campaign rhetoric and the policy priorities of key Trump constituencies. Furthermore, they were the least likely group to have very favorable feelings toward Trump (26 percent) and least likely to have voted for Trump in the early primaries (34 percent). Instead, two-thirds cast their ballots for another Republican candidate, with a plurality going to Republican Senator Ted Cruz.
Part of their vote may be explained by their near universal dislike of Clinton with an astonishing 99 percent who felt unfavorably toward her. Indeed, a slim majority say their November vote was against Clinton rather than for Trump. Furthermore, like the Staunch Conservatives, Free Marketeers are loyal Republicans with 56 percent saying they almost always vote for Republicans in elections, and 94 percent saying they voted for Romney in 2012.
Despite Paul Ryan and Ted Cruz vocally criticizing Trump throughout the campaign, the Free Marketeers maintain the most positive views of both men, 72 percent and 73 percent respectively, about 20 points more favorable than any other cluster.
These are not the type of voters that a candidate like Bernie Sanders could have won. Only 13 percent report positive views of him. Further they are ardent fiscal conservatives who support free trade. Like the Staunch Conservatives, 8 in 10 Free Marketeers oppose raising taxes on households earning more than $200,000 a year and feel cool toward unions. Further, 9 in 10 think government regulation has become excessive, that free markets best solve economic problems, that government does not need to provide health insurance, and that Congress should repeal the health care law. Free Marketeers are nearly 40 points less likely than the American Preservationists to say that Medicare, Social Security, and paid family and medical leave are very important issues.
Sixty-two percent support increasing trade with other nations and only 9 percent are opposed. These numbers remain nearly unchanged from 2012, thus indicating that Trump had less of an impact on their views of trade. They are also the most likely group (63 percent) to believe that free trade agreements help decrease the cost of products — higher than any other Trump group or non-Trump partisan group.
Like the Staunch Conservatives, Free Marketeers have a strong sense of personal agency, perception of a just world, and they reject the idea that the deck is stacked against them. Three-fourths (74 percent) disagree that our economic system is biased in favor of the wealthy, and 86 percent believe that wealth is distributed fairly in this country. Further, they are the most likely group (of Trump and non-Trump groups alike) to believe they have a say in government (60 percent) and that elections can influence the way government works (see Figure 14). Strong majorities also disagree that women often miss out on good jobs because of discrimination (74 percent) but rather have equal opportunities with men (64 percent). This cannot be explained by this group’s greater male composition: 6 in 10 women in this group share these views.
Figure 14
In contrast to every other Trump voting bloc, the Free Marketeers believe that most people try to be helpful rather than simply look out for themselves (52 percent) and a plurality believe that most people try to be fair (47 percent) rather than take advantage. This higher level of trust exceeds even non-Trump voters by nearly 15 points.
Free Marketeers tend to align with the Anti-Elites in taking a more moderate approach toward immigration. In some cases, they take a more liberal stance than partisan groups who did not vote for Trump, but take a firmer stance on illegal immigration. Free Marketeers are about half as likely as American Preservationists and Staunch Conservatives to say that immigration is a “very important” issue (46 percent). Similarly, they are 20 to 30 points less likely to oppose a citizenship path for unauthorized immigrants. Even still, they remain about 10 to 20 points more opposed than non-Trump voters.
Free Marketeers take a more liberal stance, however, when it comes to legal immigration. They are the least likely group to say we should make it harder to legally immigrate to the United States (40 percent) — about half the share of American Preservationists — and the most likely group to say we should make it easier (30 percent) similar to non-Trump Democrats. They also are the only group in which a majority have warm feelings toward immigrants (55 percent), similar to non-Trump voters.
Free Marketeers align more closely with other Trump clusters on the temporary ban on Muslim immigration to the United States with 63 percent who support it. This share is near double that of Republicans who did not vote for Trump. Nevertheless, Free Marketeers support the temporary ban with far less zeal than other Trump clusters. Only 14 percent say they “strongly support” the policy compared to 85 percent of American Preservationists and 82 percent of Staunch Conservatives. They are also about four times as likely to report warm feelings toward Muslims compared to Staunch Conservatives and American Preservationists, but still only 36 percent do so.
Like Anti-Elites, the Free Marketeers are as warm or warmer than non-Trump voters in their feelings toward Latinos (76 percent), Asians (78 percent), and African-Americans (74 percent). Less than 5 percent report having cool feelings toward any of these groups. They are as likely as non-Trump Democrats and about 10 to 20 points more likely than other Trump clusters to agree that opportunities for African-Americans has significantly improved the quality of life in the country (64 percent).
Two-thirds of Free Marketeers say race does not shape how they think about themselves. They are the least likely of Trump and non-Trump groups alike to say that their race is important to their identities (17 percent). This is 50 points lower than the 67 percent of American Preservationists who said it was important to them. Further, Free Marketeers are the least likely (11 percent) to believe that what happens to members of their racial group impacts their own lives a lot.
Free Marketeers reject ethnocultural and nativist conceptions of American identity, and do so at higher rates than even non-Trump voters. Only 2 percent think that being of European descent is important for being American, compared to 47 percent of the American Preservationists. Two- thirds also say it is not important to have been born in America, to have lived here most of one’s life, or to be Christian to be truly American. Instead, 88 percent say accepting diversity is essential to being an American, similar to the Anti-Elites and non-Trump voters.
They are the most likely group to describe themselves as “traditional” (60 percent). A majority (58 percent) call themselves “pro-life” and 50 percent oppose same-sex marriage. Further, more than two-thirds (66 percent) believe that religious liberty is a very important issue. At the same time, they are the least likely group (46 percent) to say that the death penalty is not imposed enough — nearly 30 points lower than Staunch Conservatives and American Preservationists. They are also the most likely group to disagree that women should return to traditional gender roles (85 percent), and the most likely group to know someone who is gay (88 percent).
Free Marketeers are the least likely to watch TV of the Trump voter groups — they are about half as likely as American Preservationists to watch more than four hours a day. When they do watch TV, they are most likely watching Fox News. Like the Staunch Conservatives, the Free Marketeers also have a high level of interest in politics, with 75 percent saying they follow it “most of the time,” and they have the highest level of political knowledge.
This group is disproportionately male (63 percent) like the Staunch Conservatives and is slightly younger. Free Marketeers have the most education, with 39 percent being college graduates, more than double the rate of American Preservationists and Staunch Conservatives. They are one of the most likely groups to be employed full time (52 percent). They earn higher incomes with a quarter making over $100,000 a year — compared to 9 percent of Anti-Elites and 5 percent of American Preservationists. They are one of the least likely groups to have government-provided health insurance, with only 6 percent reporting it among those under age 65.
Religion is an important part of many Free Marketeer’s lives with 65 percent identifying as Christian, and 52 percent saying their faith is very important to them. They are also the most likely Trump group to attend church weekly (40 percent).
Free Marketeers are nearly as Republican as the Staunch Conservatives. While at first 58 percent identified as Republican, after independents were asked if they lean toward one of the parties, a total of 85 percent identify with or lean toward the Republican Party. They are the most likely group to self-identify as libertarian (19 percent) and are the second most likely group to report involvement with the Tea Party movement (35 percent).
The Disengaged (5 percent)
The Disengaged are a small group who do not know much about politics. However, what they do know indicates they are skeptical of immigration, think the political and economic systems are rigged, and that Trump is the man who can make deals to fix it.
This group has very few political opinions (or very few they are willing to share). For instance, majorities say they “don’t know” if they support increasing free trade, if strong government or the free market best solves economic problems, if they believe human activity is causing climate change, or if we should raise taxes on higher income people. Further, few say they know much about politics, only 11 percent say they know “a lot,” and only 28 percent say they pay attention to politics most of the time.
These kind of responses are indicative of a type of survey taker who either refuses to answer the questions or simply does not know enough to have formed an opinion. This group was, however, willing to answer a few questions that also happen to align with Trump campaign
rhetoric.
First, they feel like the political and economic systems are stacked against them. Strong majorities believe that people like them have no say in what government does (70 percent), that elections cannot change the way things operate (54 percent), and that the economic system is biased to benefit wealthy people over them (62 percent). Further, 60 percent indicate cool feelings toward Wall Street, nearly as high as the American Preservationists.
Second, they say that Medicare (79 percent), Social Security (91 percent), and infrastructure spending (67 percent) are important priorities — all issues Trump has used to differentiate himself from other major Republican leaders.
Third, they say that immigration is a top priority (82 percent). They do not know what to do about unauthorized immigrants living in the U.S. (49 percent), they do not know if we should make it harder or easier for immigrants to come (39 percent), but a slim majority (52 percent) say they support a temporary ban on Muslim immigration. They also indicate slightly cooler feelings toward Latinos than African-Americans and Asians.
Fourth, they are fans of deal making, with 58 percent saying they want lawmakers to “compromise to get things done” over sticking to principles no matter what (see Figure 15).
Figure 15
The Disengaged are younger — 60 percent are under the age of 45, and nearly half are renters rather than homeowners (47 percent). They are disproportionately female (64 percent), and have moderate levels of education and income, particularly given their younger age. They are also less religious with 31 percent saying they have no religious affiliation three times higher than other Trump groups.
Evidence in this analysis provides some indication that concerns about immigration may arise for different reasons. These reasons may include security concerns, desires for social cohesion, procedural fairness, and nativism.
For instance, Free Marketeers are as or more likely than independents and Republicans who did not vote for Trump to have favorable views of immigrants, to favor making legal immigration easier, and to have warm feelings toward Muslims. They are also as likely as Democrats to have warm feelings toward African-Americans, Latinos, and Asians. However, they are nearly 30 points more likely than non-Trump Republicans to support a temporary ban on Muslims entering the United States. This suggests that perhaps their perceptions of security concerns, rather than nativism, may influence immigration attitudes.
Desire for social cohesion to secure social order may be another driver of Trump voters’ attitudes toward immigration. Political science theory predicts that individuals who place above average emphasis on social cohesion to secure social order will only turn against groups they perceive as a threat to societal cohesion and stability.(v) For instance, while 7 in 10 Anti-Elites have warm feelings toward African-Americans, Asians, and Latinos, only 48 percent have positive feelings toward immigrants. When people are primed to consider the possibility that immigrants are prone to criminality and are disrupting social cohesion and order — as Trump contended during his campaign — it could stir up negative feelings toward immigrants.(vi)
Alternatively, the American Preservationists have the least positive views of Latinos, African-Americans, Asians, and immigrants across the board and are most ardently supportive of restricting legal immigration. Whatever their motivations, American Preservationist attitudes toward immigration appear to be fundamentally driven by something other than security concerns and a desire for social order.
Some voters also make an important distinction between legal immigration and illegal immigration. For instance, Free Marketeers are as or more likely than non-Trump voters to favor streamlining legal immigration to U.S. At the same time, they are also considerably less supportive of offering a path to citizenship for unauthorized immigrants currently living in the U.S. This suggests that perceptions of procedural fairness in handling our nation’s immigration laws may also shape attitudes.
Evidence in this analysis provides some indication that concerns about immigration may arise for different reasons. These reasons may include security concerns, desires for social cohesion, procedural fairness, and nativism. I use a statistical model similar to what John Sides uses in his paper to predict membership in each of the five Trump voter groups. I made efforts to construct the model as similar to his as possible. However, I use survey questions asked in 2016, rather than those asked in 2012, to predict 2016 vote choice. A benefit of this method is the opportunity to include issues salient today, such as the temporary Muslim travel ban. The limitation is that we do not know which of these variables caused membership in a particular group; we simply know which variables are positively and negatively correlated.
I estimate the impact of the following factors from the VOTER Survey:
Immigration attitudes: This is a scale comprised of three questions about legal and illegal immigration: 1) if respondents support a pathway to citizenship for unauthorized immigrants; 2) if unauthorized immigrants are a drain or benefit to society; and 3) whether legal immigration should be made easier.
Support for the Muslim travel ban: This is not a scale, but support for or against a temporary Muslim travel ban.
Racial attitudes: Because of the difficulty measuring racial attitudes, I use three different
approaches:
Social issues: A two-item scale measuring: 1) opposition to same-sex marriage, and 2)
opposition to abortion.
Economic issues: A two-item scale measuring: 1) opposition to increased taxes on the wealthy, and 2) opposition to increased government regulation of business.
Trade attitudes: This is not a scale, but one item measuring support for increased or decreased trade with other countries.
Importance of entitlement programs: A two-item scale measuring the importance of 1) Social Security and 2) Medicare.
Economic anxiety: A two-item scale measuring: 1) respondents’ view of the national economy, and 2) respondents view of their own personal financial situation.
Party identification: A seven-point party identification scale from strong Democrat to strong Republican.
Controls: Gender and level of formal education.
(3) In the question battery, respondents are asked to agree to disagree with the following four statements:
The efficacy of this battery to accurately measure attitudes toward African-Americans is controversial. Experimental studies have found that answers to these questions did not change when other groups were substituted for African-Americans in the questions (e.g., Lithuanians, Albanians, Jordanians, Taiwanese, etc.). This calls into question whether these questions are actually measuring unique attitudes toward African-Americans. Source: Riley K. Carney and Ryan D. Enos,“Conservatism, Just World Belief, and Racism: An Experimental Investigation of the Attitudes Measured by Modern Racism Scales,” Working Paper, 2017.
In this section, I report the results of a statistical model that simultaneously takes into account multiple explanations to predict membership in each of the five Trump voter blocs (see Appendix E for regression tables). I run three different tests that measure racial attitudes using the three different approaches mentioned above.
American Preservationists are positively and significantly predicted by restrictionist immigration attitudes, support for the temporary Muslim travel ban, concern about entitlement programs, fiscal liberalism, social conservatism, and their level of economic anxiety. American Preservationists are the only Trump voter bloc not predicted by Republican partisanship.
Free Marketeers appear to be near polar opposites of the American Preservationists. Fiscal conservatism, support for more liberal immigration policy, opposition to the temporary Muslim travel ban, support for increasing trade, economic anxiety, and being Republican significantly predict membership in the Free Marketeer group.
Membership in the Staunch Conservatives group is also highly predicted by support for fiscal conservatism, but it is also predicted by support for a temporary Muslim travel ban, concern about entitlement programs, economic anxiety, and being Republican.
Anti-Elite membership is predicted by fiscal liberalism, social conservatism, being Republican, and perhaps weakly by support for a temporary Muslim immigration ban.
The Disengaged are significantly predicted by support for the temporary Muslim travel ban, fiscal liberalism, concern about global trade, and being Republican. However, this group is significantly less economically anxious and less concerned about entitlement programs.
Examining the different approaches to measuring racial attitudes, we find American Preservationists stand out as the only Trump voter bloc that is largely, positively, and significantly predicted by their rating whites more favorably than African-Americans. No other Trump voter group is positively predicted by these attitudes. Instead, such feelings predict against being a member of the Free Marketeer, Staunch Conservative, and Disengaged voter blocs.
The belief that whites are being widely discriminated against significantly predicts membership in the American Preservationist group and weakly in the Anti-Elites and Staunch Conservative blocs. The belief that African-Americans may not try hard enough significantly predicts membership in the Anti-Elites, Free Marketeers, and American Preservationists groups.
These results further support what earlier sections have found. There is no one particular issue or characteristic that positively and significantly predicts membership in all of the Trump voter blocs. Furthermore, factors like economic conservatism that significantly predict voting for Trump overall actually work in the opposite direction among several Trump groups (i.e., American Preservationists and Anti-Elites). Similarly, although restrictionist immigration views predict voting for Trump, they fail to predict membership in several Trump voter blocs, and even predict against being a member of the Free Marketeer group.
These results demonstrate that even though all these individuals chose to vote for Trump in the general election, they hold vastly different views on immigration, American identity, race, economics, and moral traditionalism. They also hold different perceptions of justice in the political and economic systems. Despite these differences, they appear to have four views in common.
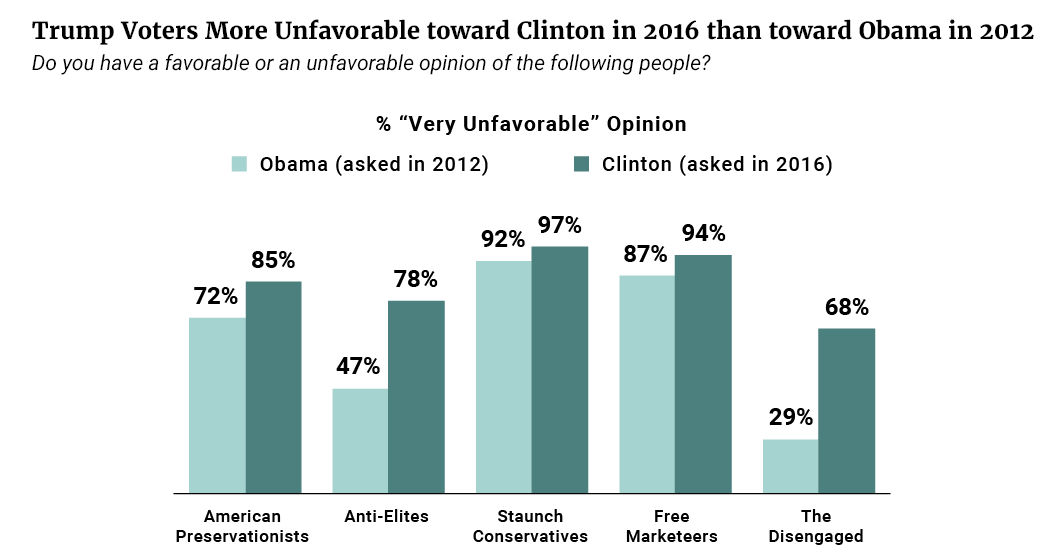
First, they share an intense dislike of Clinton — about 9 in 10 of each group has an unfavorable opinion of her. In fact, animus toward Clinton following the 2016 campaign exceeds animus directed toward Barack Obama after the 2012 campaign within each of the five Trump voting blocs. For instance, American Preservationists were 13 points more likely to strongly dislike Clinton than Obama, and Anti-Elites were 31 points more likely, and the Disengaged were 39 points more likely (see Figure 16).
Figure 16

This universal dislike of Clinton among Trump voters is a relatively new phenomenon among American Preservationists and Anti-Elites, given that nearly half had positive views of Clinton in 2012 (see Figure 11). Had the American Preservationists and Anti-Elites not turned against Clinton between 2012 and 2016, Trump may have very well lost the election.
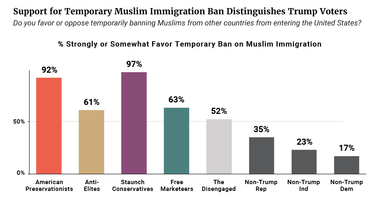
Second, support for the temporary ban on Muslim immigration among Trump voters far exceeds support among non-Trump voters. It is true there is wide variation even across Trump groups, with American Preservationists and Staunch Conservatives being about 70 points more likely than Free Marketeers and Anti-Elites to “strongly” support the temporary ban. Even still, majorities of all Trump groups are at least “somewhat” in favor it. In stark contrast, no partisan group of non-Trump voters comes close to majority support for the ban: only 35 percent of Republicans, 23 percent of independents, and 17 percent of Democrats who did not vote for Trump support the temporary ban (see Figure 17).
Figure 17
Third, attitudes about how to handle illegal immigration distinguish Trump voters. For instance, pluralities of non-Trump Republicans, independents, and Democrats all support a path to citizenship for unauthorized immigrants. In contrast, only one Trump cluster reaches plurality support — the Anti-Elites — with 45 percent in support. However, immigration attitudes do not distinguish Trump voters across the board. Free Marketeers tended to take a similar or even more liberal approach than some non-Trump partisans in allowing more legal immigration and in their warm temperature rating toward immigrants.
Fourth, Trump voters tend to have a more dismal view of their personal financial situations. About 4 in 10 Trump voters report their economic situation has worsened over the past year compared to about 2 in 10 non-Trump partisans. However, there is no significant difference between Trump voters and non-Trump voters in perceptions of mobility and opportunity for their children.
Notably, despite much talk from Republicans promising to repeal the health care reform law if they won the White House, opposition toward the health care law does not largely distinguish Trump voters from non-Trump voters. A majority (65 percent) of Republicans who did not vote for Trump also favor repealing the law.
Evaluations of the economy, attitudes toward Hillary Clinton, illegal immigration, and Muslim immigration — but not immigration across the board — largely distinguish the Trump voters from non-Trump voters.
In sum, evaluations of the economy, attitudes toward Clinton, illegal immigration, and Muslim immigration — but not immigration across the board — largely distinguish the Trump voters from non-Trump voters. Nevertheless, the five Trump clusters identified here still vary considerably even on these topics. Further, they diverge on a wide variety of today’s salient issues including on taxes, entitlements, immigration, race, pluralism, traditionalism, and social conservatism. This degree of heterogeneity among the Trump voters makes it difficult to speak about their values, priorities, and opinions as a group.
Thus, discussions of the 2016 election and the phenomenon that catapulted an unlikely candidate to the Oval Office should acknowledge that different types of people came to vote for Trump and not all for the same reasons.
About the Author
Emily Ekins is a research fellow and director of polling at the Cato Institute. She is the author of “Policing in America: Understanding Public Attitudes Toward the Police,” which investigates the drivers of public opinion toward the police and reform. Emily’s other publications include “The Libertarian Roots of the Tea Party," and "Millennials: the Politically Unclaimed Generation." She holds a Ph.D. and M.A. in political science from the University of California, Los Angeles.
The views and opinions in this paper are those of the author and do not necessarily reflect the views and opinions of Democracy Fund.
I estimated the Trump voter classifications based on a universe of general election Trump voters using latent class models for polytomous outcome variables which estimates membership in the latent classes by seeking to maximize the log-likelihood function. While it is possible the model may only find a local rather than global maximum, several thousand simulations were run, with different starting values, in efforts to find the best fitting model. I employ latent class analysis rather than some other clustering method because it is particularly useful when handling data with discrete categorical variables, such as those available in the survey.(1)
I identified manifest variables to include in the model based on existing theories of Trump voter mobilization including questions on economic populism, nativism, racial attitudes, nationalism, traditionalism, perceptions of a rigged system, economic anxiety, as well as favorability toward candidates. The following variables were used in the latent class analysis:
LCA does not determine the ideal number of classes. Instead the number of classes is selected by the researcher on the basis of model fit, parsimony, and theoretical reasons. To assess model fit, I iteratively ran models of one through six classes. Based on minimizing the Bayesian information criterion (BIC) and Akaike information criterion (AIC) values and assessing model clarity and theory, I determined that 5 classes are the appropriate number. Four clusters failed to detect a unique cluster of voters. A six-cluster solution did not produce clearer classes and appeared to largely duplicate an existing class with minor differences. Thus, I moved forward with the five-cluster model. In future research, it may be useful to explore more complex models of Trump voters since even within these five clusters there is meaningful variation.
We should keep in mind that this methodology, and market segmentation generally, is both an art and a science and the groups identified depend on the questions asked on the survey, what we think the answers mean, which manifest variables we include in the LCA analysis, and how we interpret the results.
(1) Another benefit of this method is that it does not impose assumptions about the structure of the responses. For instance, it treats all responses like categorical variables (e.g., yes/no) rather than ordinal variables (e.g., 1, 2, 3).


Subscribe to our mailing list for updates on new reports, survey data releases, and other upcoming events.

