
Why America’s 2-party system is on a collision course with our constitutional democracy
Lee Drutman
Vox March 26, 2018

Key Findings
Third parties are a perpetual fascination of American politics. Each presidential election cycle brings its own new wave of punditry calling the nation to consider whether this will be the year in which a third party finally breaks through, upending a system in which the two parties have existed in lock-step competition for 160 years — longer than most of the world’s democracies.
There is plenty to froth the speculation ahead of the 2020 election cycle. Are the parties veering too far apart, leaving an open route for a potential centrist presidential candidate like Ohio Governor John Kasich? Is President Donald Trump vulnerable to an insurgent Republican challenger? As this report shows, a record-high 68 percent of Americans say the two parties are not doing an adequate job, and they would like to see a third party.
Our report offers two reasons to be skeptical that a new third party is imminent.
First, while support for a hypothetical third party is high, consensus collapses on the specifics of what, exactly, that third party should stand for. About one-third of those supportive of a third party want a party of the center, but about one-fifth want a party that is more conservative than the Republicans, and about one-fifth want a party that is more liberal than the Democrats.(1) No single third party emerges as a focal point of change. It would take at least five and possibly even six parties to adequately represent the ideological yearnings of the American people.
Second, partisans are reasonably well contented with their parties, and particularly motivated by a dislike of the other party. In a single-round plurality election system, taking a chance on a third party is a costly gamble when a person believes that there are real differences between the two parties. Even voters who have some qualms about their own party view the opposing party as far worse. In a single-round plurality system, voting for a third party requires widespread feelings of indifference between the two major parties. The overwhelming majority of voters, including self-identified independents, do see a difference.
Certainly, there are many signs of discontent with the current party system. But so far, that discontent doesn’t add up to support for an alternative that could topple the two leading choices given the existing electoral system.
Could the existing system change to allow for more parties? It’s possible. But it would take major structural reforms. Our analysis suggests that voters are largely unaware of possible reforms to open up the party system to third, as well as fourth and fifth parties. And they don’t connect those reforms to changing the party system. If Americans are to fulfill their stated desire for a third party, it will take considerable work by reformers to make the connection between electoral laws and electoral choices.
(1) Smaller numbers who say they want a third party either describe their desired party in ways that reflect the existing Democratic or Republican parties, or they describe a desired a third party that blends Republican and Democratic positions, defying our ability to plot their preference on a simple liberal-to-conservative spectrum.
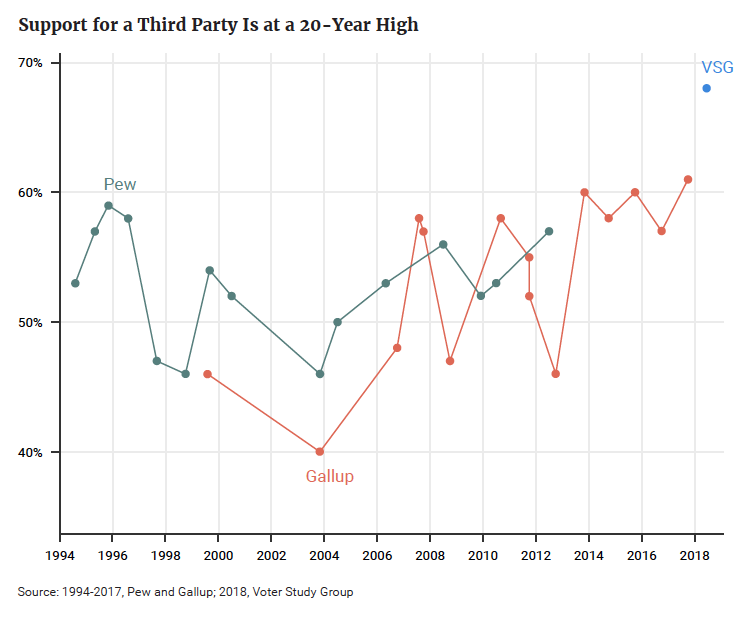
Almost seven in 10 Americans (68 percent) say a third party is needed in American politics, a rate higher than the results of other known polls to date. We examine this finding of the Democracy Fund Voter Study Group 2018 VOTER Survey (Views of the Electorate Research Survey) in historical context, reconstructing data from Pew Research Center and Gallup polls going back to the mid-1990s to construct a fuller time series (Figure 1).(2)
(2) Both Gallup and the VOTER Survey asked the question: “In your view, do the Republican and Democratic parties do an adequate job of representing the American people, or do they do such a poor job that a third major party is needed?” (Lydia Saad, “Perceived Need for Third Major Party Remains High in U.S.,” Gallup News, Gallup, September 27, 2017. Available at: https://news.gallup.com/poll/219953/perceived-need-third-major-party-remains-high.aspx.) Pew Research Center asked a different variation: “Some people say we should have a third major political party in this country in addition to the Democrats and Republicans. Do you agree or disagree?”
Figure 1
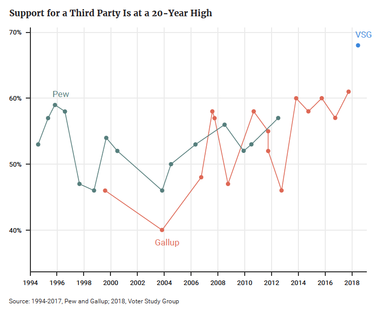
The time series shows support for a third party was close to 60 percent in the mid-1990s, then declined for about a decade until 2003, when majorities reported being satisfied with the two parties. By the mid-2000s, support for a third party was again the majority view, and it has been edging up since 2012. Only time will tell whether this 68 percent support level represents a temporary peak or a harbinger of further dissatisfaction.
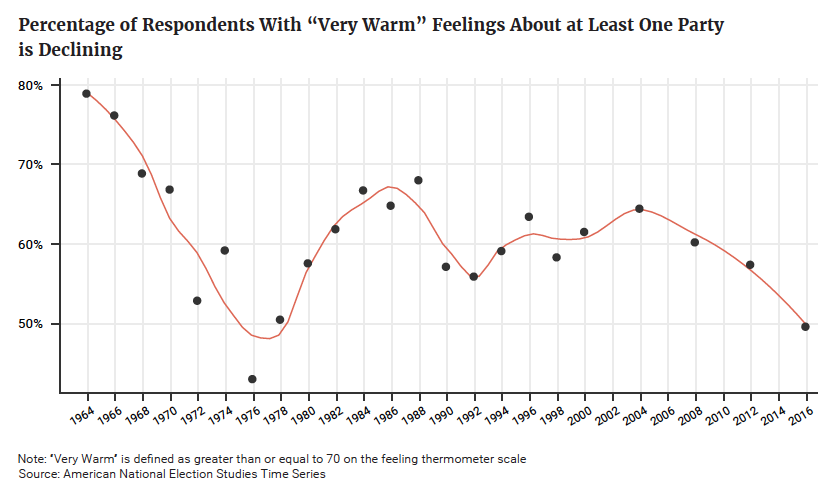
The trend in support for a third party appears related to feelings toward the major parties. Since 1964, the American National Election Studies (ANES) Time Series has asked respondents to place both parties on a feeling thermometer ranging from 0 to 100 (Figure 2). The share of respondents who gave either (or both) of the two major parties a rating of at least 70, suggesting real warmth toward at least one of the two parties, has ebbed and flowed in a mirror-image fashion to support for a third party.
Figure 2
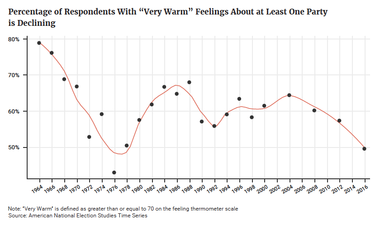
Support for a third party was also high in the 1990s, when around 60 percent of ANES respondents viewed either of the two parties warmly. But it fell as favorable feelings toward a major party increased and peaked in 2004, when 65 percent viewed at least one party very favorably. Since then this percentage has declined, hitting a low of 50 percent in 2016 — just as support for a third party increased.
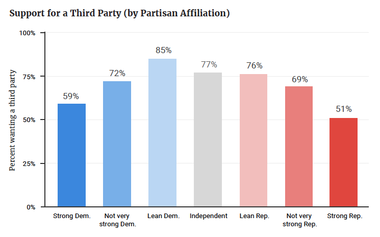
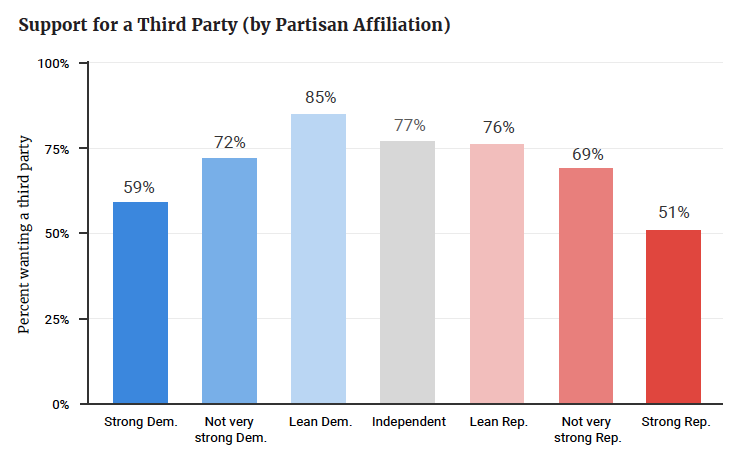
Broken down by the strength of their identification with either party (Figure 3), independents, “leaners,”(3) and “not very strong” party supporters are more likely to favor a third party than “strong” supporters of the existing parties, but even majorities of those who strongly identify with one party or the other would like to see a third party.
There is also some asymmetry. Strong Democrats are eight percentage points more likely to say a third party is needed than strong Republicans (59 percent to 51 percent), and those who “lean Democrat” are nine percentage points more likely to call for a third party than those who “lean Republican” (85 percent to 76 percent).
(3) Leaners are those who do not self-identify as partisans but vote as partisans.
Figure 3
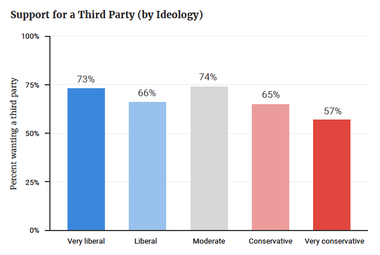
A similar pattern emerges with ideology (Figure 4), with an even more pronounced asymmetry between those who are “very liberal” (73 percent want a third party) and those who are “very conservative” (57 percent want a third party). But self-described moderates also are very dissatisfied with the two parties (74 percent want a third party). Appendix A provides a more detailed analysis of the relationship between partisanship, ideology, and desire for a third party.
Figure 4
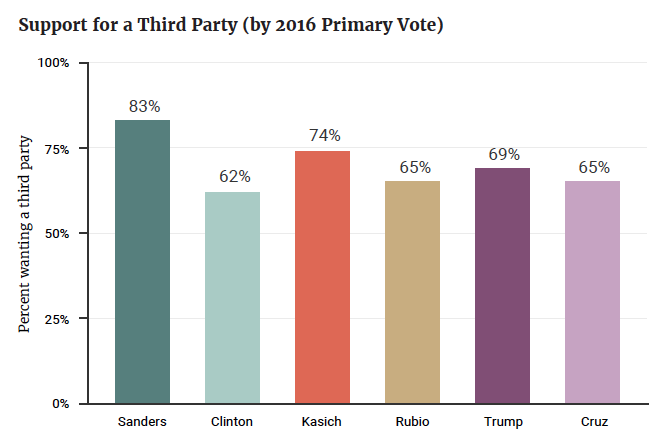
Segmenting the population by how people voted in the 2016 presidential primary (Figure 5), the highest support for a third party comes from those who supported Senator Bernie Sanders (83 percent desire a third party). As demonstrated in the 2017 Voter Study Group report “Political Divisions in 2016 and Beyond: Tensions Between and Within the Two Parties,” Sanders voters tended to be distinguished from Hillary Clinton voters by their distrust of and antipathy toward the political establishment. It’s not surprising that they would call for a third party.
Figure 5
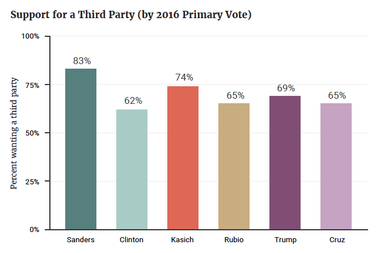
The next highest desire for a third party comes from those who supported Kasich in the Republican primary (74 percent want a third party). These voters tend to be independent and moderate, characteristics that both correlate with the desire for a third party. It’s notable that even though Trump is president, 69 percent of those who supported him in a primary want a third party. Among primary supporters of the two most conventionally conservative candidates, Senator Ted Cruz and Senator Marco Rubio, perceived need for a third party is lower, but still stands at 65 percent.
In summary, desire for a third party is widespread across the ideological and partisan spectrum, though it is highest among those who identify as independent, moderate, and very liberal, and those who supported either Sanders or Kasich. But in every single category, majorities agree that the two parties do an inadequate job, and a third party is needed.
While majorities agree that a third party is needed, consensus breaks down quickly when we probe further. What should that party actually look like? Here, there is no agreement.
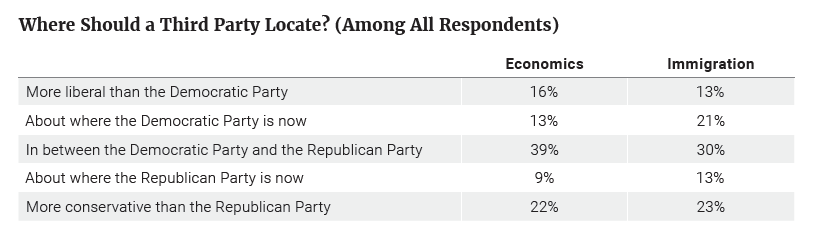
The 2018 VOTER Survey also asked respondents where they would place a third party, should such a party exist, in relation to the existing parties on questions of economics (as defined by how much the government spends and how many services it provides) and immigration — the two most salient issues in American politics right now.(4)
In Table 1, we present the top-line results among all voters participating in the survey.
Table 1
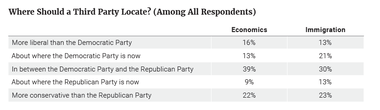
(4) Specifically, the 2018 VOTER Survey asked: “If you were to vote for a new third party, where would you like it to stand on economic issues — like how much the government spends and how many services it provides?” and “If you were to vote for a new third party, where would you like it to stand on the issue of immigration?” The VOTER Survey also asked about support for a third party on “social and cultural issues — like abortion and same-sex marriage?” Attitudes on this question were closely correlated with attitudes on the immigration questions, so including this dimension within the analysis did not add enough insight to justify the added complexity.
We also examined the results along both dimensions for those who affirmatively want a third party (Figure 6). Shading represents frequency. The more populated the cell, the darker the color. Note: Percentages for a question may not add up to 100 percent exactly due to rounding.
Figure 6
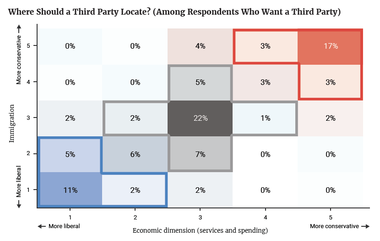
This analysis shows why a third party doesn’t gain traction. There is no agreement on what that third party should be. There is demand for a party that is more liberal, a party that is more centrist, and a party more conservative than the current two parties. In short, to represent this diversity of views, American democracy needs not two or three parties, but at least five parties.
Among the 68 percent of voters who support a third party:
We also note that there is no significant support for a Michael Bloomberg-style party that would be more liberal on immigration and centrist on economics. This is consistent with the Voter Study Group report “Political Divisions in 2016 and Beyond”, which found only 4 percent of voters held economically conservative but culturally liberal views.
To be sure, there are two important caveats here.
First, these data suggest little support for a “populist” candidate who promises to spend more on social welfare while tightening the borders, which seems to contradict both the rise of candidate Donald Trump and the “Political Divisions in 2016 and Beyond” report, which showed that almost three in 10 voters held left-of-center views on economic issues and right-of-center views on cultural and social issues. This may reflect the framing of the question, which asked respondents whether they wanted a party that was more liberal than the Democratic Party on how much the government spends and how many services it provides. Political science literature has long shown that while many self-described conservatives want government to spend more on specific programs, they also want to spend less on government in general.(i) Trump exploited this contradiction in the 2016 primaries. If there is support for a populist third party that these data do not capture, it only bolsters the broader takeaway: that a third party does not emerge because those who want a third party can’t agree on which type of third party they want.
Second, substantial political science evidence suggests that ideology is not particularly stable and may be more a reflection of identity (partisan and otherwise) than it is a reflection of deeply held beliefs.(ii) If so, support for a possible third party could depend on the emergence of a particularly compelling candidate. After all, despite stated preferences among Republican voters for a “conservative” candidate, they voted for Donald Trump who, as a candidate, broke with conservative orthodoxy in many policy areas.
But there is a caveat to the caveat: Given the nature of plurality-winner elections, even those who might prefer a charismatic third-party candidate should still vote strategically for one of the major two parties, unless they see no difference between the two parties. It turns out they do see a difference. We now consider that question.
A second complicating factor working against the emergence of a third party is that even if they’d like a third party in theory, few partisans seem likely to abandon their own party in practice. This is both because partisans feel well-represented by their parties, and because they feel very poorly represented by the other party.
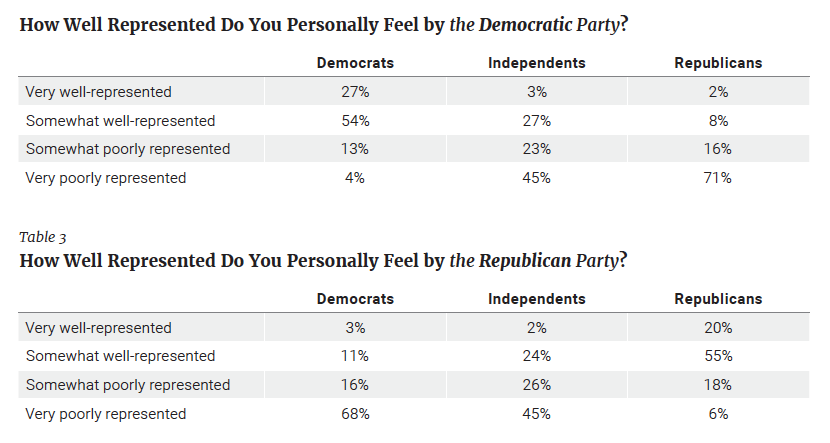
The 2018 VOTER Survey asked voters how well represented they felt by each of the two parties.
Below we report the results of how well represented each group feels by both parties. Independents here are self-identified independents and include the group described earlier in this report as “leaners.”
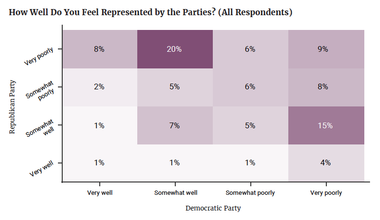
Table 2 and Table 3
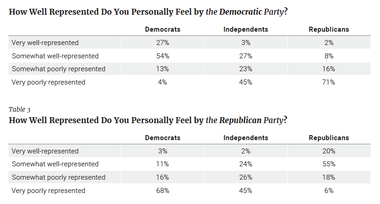
Two points should jump out from this analysis.
First, partisans generally feel well-represented by their parties. Four in five Democrats (81 percent) feel “somewhat” or “very well-represented” by their party, while three in four Republicans (75 percent) feel “somewhat” or “very well-represented” by their party.
Second, partisans feel very poorly represented by the other party. About seven in 10 Democrats and seven in 10 Republicans feel “very poorly represented” by the opposite party.
In other words, few partisans seem likely to abandon their own parties for a third party, assuming they calculate that doing so would mean a victory for the other major party. The majority of partisans describe themselves as being “somewhat well-represented” by their parties (54 percent of Democrats, and 55 percent of Republicans), and while the figures are lower for those who feel “very well-represented” (27 percent of Democrats, and just 20 percent of Republicans), “somewhat well-represented” is a reasonable standard in a country with big-tent parties and a long history of anti-party sentiment.
In our sample, 36 percent identify as Democrats and 26 percent identify as Republicans, which adds up to only 62 percent of the electorate identifying as partisan. Gallup’s polling finds that over the past year, the share of the population identifying as Republican has hovered around 25 percent, the share identifying as Democrat has hovered around 29 percent, and the share identifying as independent has hovered around 43 percent.(5) Our sample has 30 percent identifying as independents, with another 8 percent refusing to state an affiliation.
Below we examine whether self-identified independents are uniquely poorly represented by the parties.
(5) “Party Affiliation,” Gallup News, Gallup. Available at: https://news.gallup.com/poll/15370/partyaffiliation.aspx.
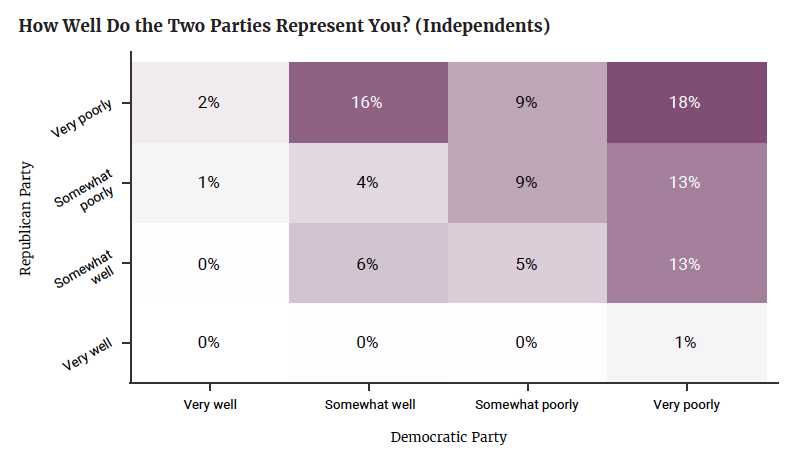
Figure 7
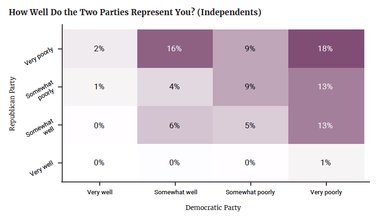
Two points are key here.
First, two-thirds of independents feel more represented by one of the parties than the other. The share of self-identified independents who appear to be equivocal between the two parties is equal to the sum of the diagonal squares from the bottom left to the upper right. In total, 33 percent of independents see both parties as representing them equally well (just 6 percent) or equally poorly (27 percent). This is consistent with much political science literature on independents, which shows that independents do have a preference, and tend to vote like closet partisans.(iii) Assuming independents comprise 40 percent of the overall electorate, that would leave only 12 percent of the electorate that is both self-identified independent and equivocal between the two parties.
Second, a slight majority of independents feel poorly represented by both parties. Adding the four cells in the upper-right quadrant shows that more than half (51 percent) of independents feel “somewhat” or “very poorly represented” by both parties, and 18 percent feel “very poorly represented” by both parties. While this might suggest more support for a third party, independents are like the broader population in one important respect — even if they want a third party, they do not agree on what that party should stand for. (Appendix B provides a breakdown of third-party positioning by partisanship and by 2016 primary support.)
Among all respondents, 23 percent are equivocal between the two parties, which is hardly the basis for a strong third party. Put another way, 77 percent of Americans feel more represented by one party or the other. About 29 percent of the electorate feels “somewhat” or “very poorly represented” by both of the two major parties. This is also not enough for a viable third party if it is to be more than a “spoiler” for one of the two major parties, though it’s getting closer — but only if there were agreement on what that third party should stand for.
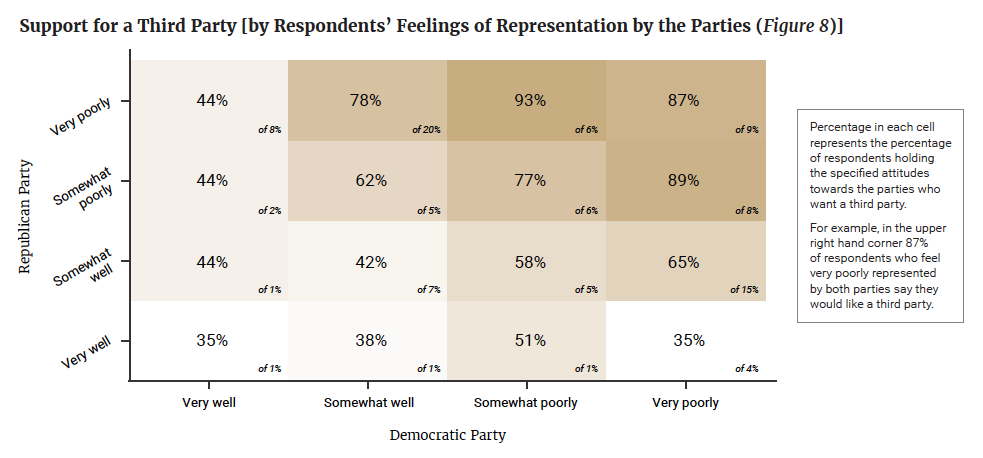
Figure 8
Feeling poorly represented by the parties does contribute to supporting a third party. In Figure 9, we present the same matrix, but report the percentage of respondents in each cell who say a third party is needed, and shade accordingly.
Figure 9
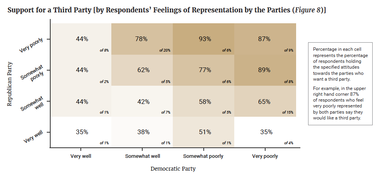
Not surprisingly, the strongest support for a third party comes from voters in the four upper-right quadrant cells — those who don’t feel well-represented by either party.
In terms of support for a third party, there is a difference between feeling “very” and “somewhat well-represented,” especially among partisans who feel “very poorly represented” by the other party. Among Democrats who feel “very well-represented” by their party and “very poorly represented” by Republicans (8 percent of respondents shown in the upper-left single cell, Figure 8), only 44 percent want a third party (Figure 9). But among the 20 percent who feel “somewhat well-represented” by the Democratic Party and “very poorly represented” by the Republican Party (Figure 8), 78 percent support a third party (Figure 9).
A similar pattern holds among Republicans. The weakest support for a third party is shown in the lower-right corner — among the 4 percent of voters who feel “very well-represented” by Republicans and “very poorly represented” by Democrats (Figure 8). Only 35 percent want a third party (Figure 9). But among the 15 percent who feel “somewhat well-represented” by the Republicans but “very poorly represented” by the Democratic Party (Figure 8), 65 percent support a third party (Figure 9). Thus, there is a difference between feeling “very well-represented” and “somewhat well-represented.”
Of course, telling a pollster that a third party is needed is not equivalent to being likely to vote for a third party. Most Americans see a clear difference between the two parties — self-identified partisans generally feel well-represented by their own party, and even the majority of independents see a difference between the two parties. These facts will not help a third party become truly viable.
Even more forbidding for a third party is the lack of agreement on what a third party should stand for. Americans don’t want a third party so much as they want third, fourth, and fifth parties. The emergence of a third party may therefore require electoral reforms that make it easier for third parties to develop without being viewed as “spoilers.”
The structural reason the United States has two parties is because of its electoral institutions. Specifically, the “first-past-the-post” system of single-winner plurality electoral districts, which renders third parties as spoilers, thus discouraging support for and investment in them. Nationalized and “presidentialized” politics also play an important role in focusing attention on two major parties, and primaries open to all aspirants provide a path for dissenting voices to try to take over a major party rather than form their own. Encouraging third parties would thus require major changes to electoral rules.
One alternative approach is ranked-choice voting, which was just approved by Maine voters for a second time and is used in several cities across the country. In a ranked-choice voting system, voters rank candidates on the ballot in order of preference: first choice, second choice, third, etc. The votes are then tallied as follows: If one candidate has more than 50 percent of the first-place votes, that candidate is the winner. If not, the last-place finisher is eliminated, and those who picked that candidate as first choice get their second-choice selection tabulated. This continues until a single candidate achieves a majority. In close elections with many candidates, the process can take several rounds. Ranked-choice voting can encourage third parties because it takes away the “spoiler” aspect of third parties. Voters can support a third party sincerely, and vote for a major party as a second choice strategically.
As applied to single-winner elections, however, ranked-choice voting would still leave many U.S. House of Representative seats in very liberal or very conservative districts, so the expansion of third parties would be limited. Opening space for more parties would necessitate combining ranked-choice voting with multimember districts — which are districts that elect more than one representative.(iv) This system is known as single transferrable vote (STV) and is used in Ireland and to elect the Australian Senate. It also was used in 24 American cities up to the middle of the 20th century, as part of a series of city-government reforms.(v) In both Ireland and Australia, two dominant parties consistently garner about 75 percent of the vote, with a handful of smaller parties coming and going.(vi)
Under STV, candidates are elected in multimember districts. On Election Day, voters rank the candidates in their preferred order. Like the single-winner, ranked-choice voting system, candidates get eliminated from the bottom up, and their supporters have their votes transferred to their second-favorite candidate. The difference is that there are multiple winners, creating some proportionality.(6) Instead of votes being aggregated up until a single candidate gets a majority, all the votes are aggregated. In a five-member district, the top five finishers (after all votes were redistributed) would go to Congress.
(6) Instead of votes being aggregated up until a single candidate gets a majority, votes are aggregated to quotas. The quota is the number of votes a candidate needs to win a seat. As the number of seats in a district goes up, the size of the quota goes down. In a five-member district, for example, each winning candidate would need about 17 percent of votes — whether those were first-choice votes cast for that candidate, votes they got from eliminated candidates, or votes they got from other winners who had more votes than a quota. When voters of a certain party restrict their rankings to candidates of that party, the logic of quotas is how STV produces seats-to-votes proportionality. See David M. Farrell and Richard S. Katz, “Assessing the Proportionality of the Single Transferrable Vote,” Journal of Representative Democracy, Volume 50, Issue 1, pp. 13-26, May 2014. Available at: https://doi.org/10.1080/00344893.2014.902212.
Creating multimember districts with ranked-choice voting would require an act of Congress. Increasing the size of the House would make this politically easier, because individual members would be more likely to retain their seats even as multimember districts are created, and smaller states would get enough representatives to create multimember districts.(7)
The purest version of proportional representation is a party list system such as the Netherlands employs, in which parties choose candidates, and voters choose parties in one nationwide election. Parties get seats in the legislature in direct proportion to how many votes they gather, with very low thresholds.
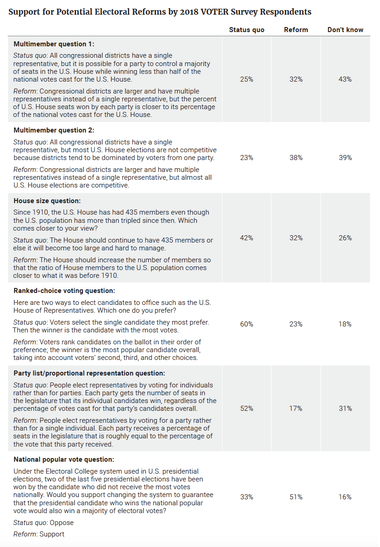
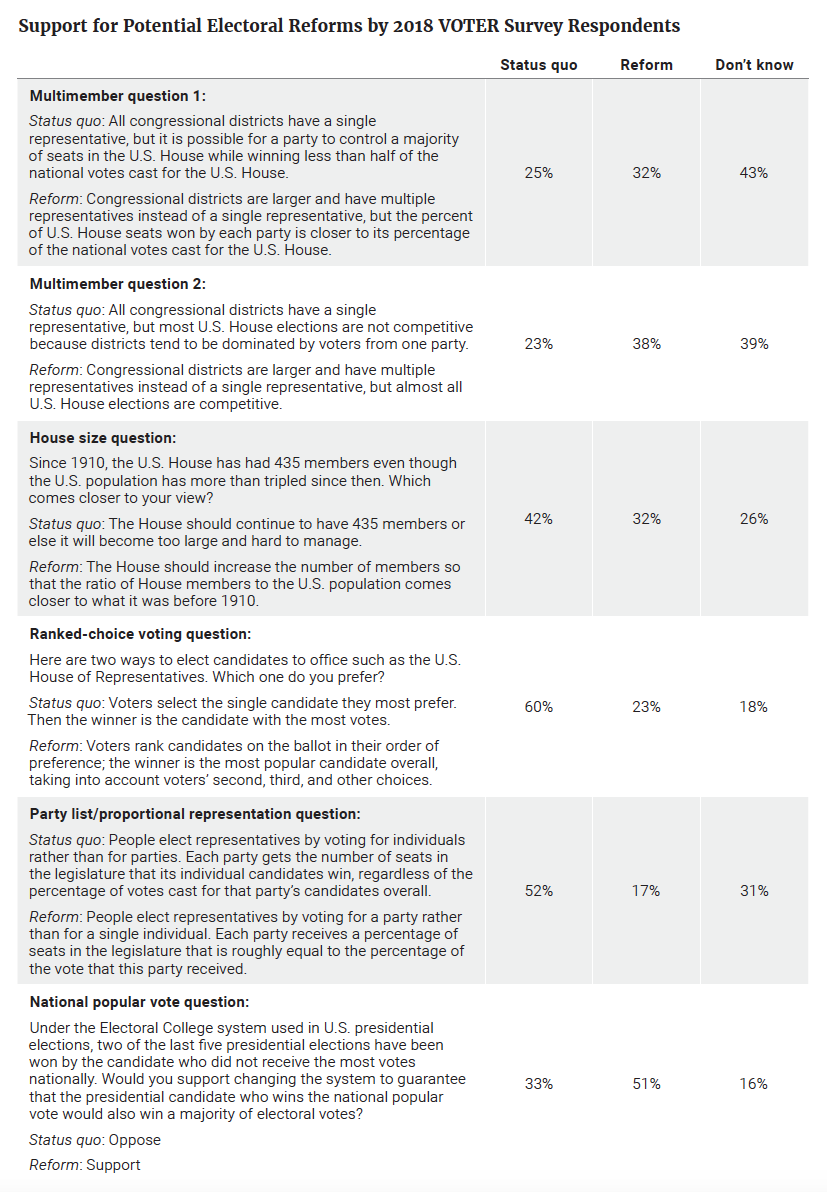
The 2018 VOTER Survey asked about support for multimember districts, increasing the House size, ranked-choice voting, and the party list system. It also asked about replacing the Electoral College with a national popular vote, a reform that has enjoyed much more public discussion.
The questions about multimember districts were framed two ways. One emphasized the benefit of increased competition, while the other emphasized the benefit of better translation of votes to seats. While “don’t know” was the most common response, those who answered the question otherwise preferred reform to the status quo.
The questions on ranked-choice voting and party list proportional representation did not emphasize benefits but instead simply described the systems. Support for these options was weaker.
(7) Multimember districts were widely used in the United States prior to 1842, when the Whigs mandated single-member districts in an (unsuccessful) attempt to stave off midterm losses. However, the early multimember districting scheme allowed voters to choose a slate of candidates equivalent in size to the number of seats. This almost always meant one-party congressional delegations. This is not proportional representation, and it is very different from the single transferable vote system, which gives individual voters only one vote, albeit a transferable one. In 1967, Congress passed the Uniform Congressional Districting Act, which was intended prevent southern states from using the block vote to disenfranchise black people as a response to the Voting Rights Act and one-person, one-vote Supreme Court cases.
Table 4
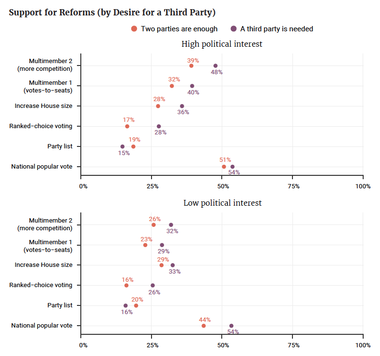
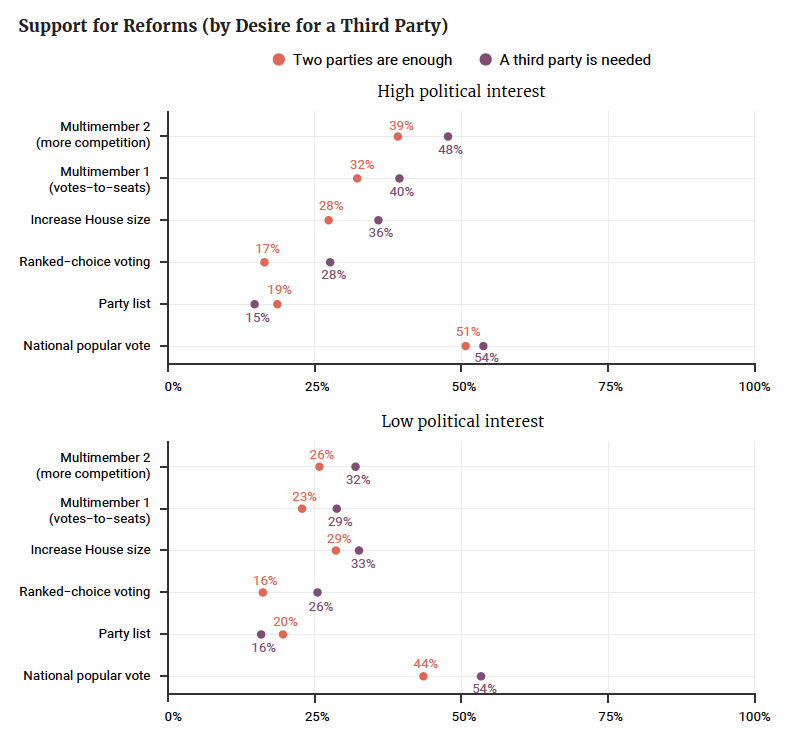
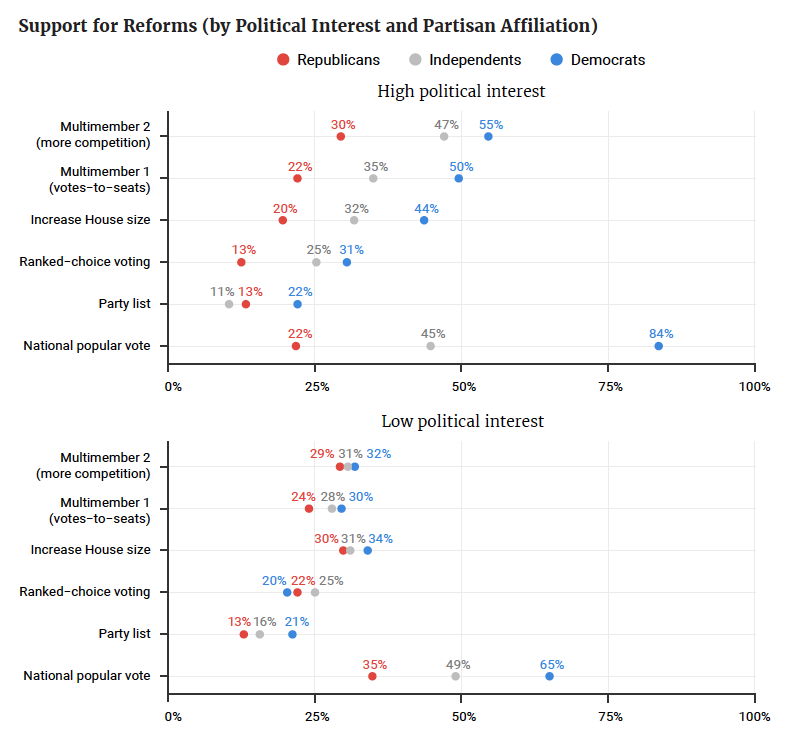
One question is whether respondents actually understand the implications of these reforms. Are supporters of third parties more likely to support reforms that would allow third parties to flourish? The evidence here suggests only few make the connection.
Even respondents who do follow politics closely are not more likely to connect any desire for a third party to support for these reforms. The differences in support for reforms between those who do and do not favor a third party are similar, no matter whether respondents reported a higher or lower level of attention to politics.
Figure 10
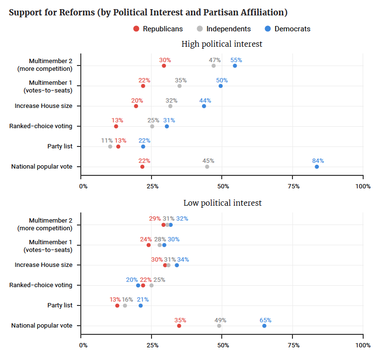
By contrast, there are much larger differences in support for reforms between Democrats and Republicans, especially among those with higher political interest, suggesting that respondents are seeing these questions in partisan terms. Democrats are more willing to change the status quo — perhaps because the status quo appears to benefit Republicans, or perhaps because Democrats tend to be more willing to undertake reforms generally.(8)
(8) Among Democrats, those who supported Sanders are more supportive of these reforms than those who supported Clinton. Among Republicans, Kasich supporters are the most supportive of reforms.
Figure 11
We suspect that had the reforms been framed in terms of making it easier for third parties to compete, they would have been more popular, and other recent polling suggests this indeed the case. In other polling, when respondents are given more extensive pro/con arguments for reforms and “pro” arguments involve making space for third parties, they became more supportive of these reforms. Overall, 55 percent of respondents (and 64 percent of Democrats) supported ranked-choice voting after hearing a case for it that explained how it can prevent spoilers and encourage third-party candidates. Similarly, 55 percent of respondents (and 66 percent of Democrats) supported multimember districts after reading a more detailed explanation of how a single transferable vote system could work in multimember districts.(vii)
But absent a polling question that makes the connection, few respondents make the connection themselves. These results suggest reformers have considerable work to do if they are to convert widespread support for a third party into support for a reform that would make it easier for third parties to gain traction.
The 2020 presidential cycle will likely bring the excitement about a possible breakthrough third-party candidate. After all, as decades of polling data show, majorities of Americans would like there to be a third party. But as decades of experience show, it’s almost impossible for a single third party to break through in American politics.
The 2018 VOTER Survey data provide some encouragement for the boosters — but much more for the skeptics. The 68 percent of Americans who want a third party does suggest a widespread desire to transcend the current binary competition. And there is also some dissatisfaction with representation by the existing two parties, though this is nothing new. But desire for a third party does not translate into support for a single third party — instead there is support for multiple, very different parties. And no hypothetical party would be more popular than either the Democrats or Republicans in its policy positions. Likewise, partisans mostly feel well-represented by their parties, and see clear differences between the two parties.
For a third party to gain traction in the existing electoral system, a plurality of voters would have to feel equally poorly represented by both parties and have similar enough political preferences to unite behind a third party. This is currently not the case — but that may not always be true.
The historical record suggests at least two ways in which a third party could emerge.
The first would be a new issue that cuts across the existing parties, splitting them in ways that cause their downfall. This is how the Republican Party emerged in the 1850s. As westward expansion forced the slavery issue to center stage, the Whig Party couldn’t hold together its northern and southern wings. The Republicans united Northern Whigs, some Northern Democrats, and a few smaller parties into a new party, and won the 1860 election with 39 percent of the popular vote when Democrats also split, nominating separate northern and southern candidates. It would take a similar scenario for a third party to break through at the national presidential level.
The second possibility is for a popular movement for electoral reform to catch on, and for elected politicians to support electoral reforms like ranked-choice voting or single transferable vote. Perhaps the introduction of ranked-choice voting in Maine will spark more movement in this direction. While history is full of examples of democracies that have changed their electoral systems — New Zealand, Israel, Italy, and Japan have recently done so — it takes a rare combination of popular discontent with the electoral system and political entrepreneurs who see reform as in their own interest to make change happen.
The 2018 VOTER Survey provides no basis for concluding that either of these scenarios is imminent.
Combining ideology and partisanship shows a more complex matrix. Shading represents frequency in the overall population. Not surprisingly, independent moderates overwhelmingly want a third party.
As before, partisan asymmetries show up. Fifty percent of conservative/strong Republicans are satisfied with the two-party system, which is to say that even in the most satisfied group, half are not satisfied.
By contrast, 58 percent of liberal/strong Democrats want a third party, and 64 percent of very liberal/strong Democrats want a third party. The strongest support for a third party comes from those who call themselves “very liberal” and consider themselves weakly affiliated with the Democratic Party. Given the high support for a third party among Sanders voters, this is not surprising. But as the shading indicates, these voters are not numerous. Party affiliation and ideology are closely correlated, producing the darker squares along the diagonal from very liberal/strong Democrat to very conservative/strong Republican. Consider, however, the six lighter squares in the corners opposite the dominant ideological/ party distribution — those represented by conservative Democrat-leaning voters and liberal Republican-leaning voters. The latter, in the lower right, are vanishingly small in terms of overall respondents. The former, in the upper left, are more numerous, with most falling in the cell for “conservative” and “not very strong” Democrat. Their support for a third-party candidate, at 66 percent, is about the same as the support of very liberal/strong Democrats for a third party (64 percent). Support for a third party among strong Democrats is weakest among those who describe themselves as “conservative” or “very conservative” — a small but not trivial number of voters.
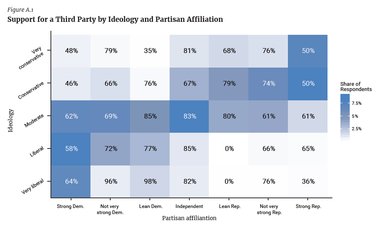
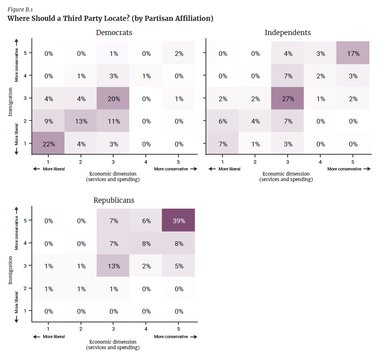
Figure B.1 shows the kinds of third parties partisan sub-groups would like to see, limiting the sample to those who actually want a third party. Almost 40 percent of Republicans who want a third party want it more conservative on both economic and immigration dimensions — about three times as many as those who would like a more centrist party. Democrats, on the other hand, are almost equally divided between those who would prefer a more centrist third party (20 percent) and those who are seeking a more liberal alternative (22 percent). Among independents, the largest group (27 percent) would prefer a more centrist third party, but a significant minority, 17 percent, want a more conservative third party. Few independents are seeking a more liberal alternative in a third party. Note: Percentages for a question may not add up to 100 percent exactly due to rounding.
Figure B.2 further breaks down respondents by whom they supported in the primaries. A party of the far left would appeal to Sanders supporters and some Clinton supporters. A party of the middle would appeal most to Clinton, Kasich, and Rubio supporters. A party of the far right would appeal to Trump and especially Cruz supporters. If there were a party moderate on economic issues and conservative on social issues, it might pull in some Trump supporters.

Subscribe to our mailing list for updates on new reports, survey data releases, and other upcoming events.
