
Melting Pot or Civil War?
National Review September 28, 2018

Key Findings
On no issue have the political dynamics changed more in the last few years than on the issue of immigration. A country seemingly on the cusp of immigration reform early in President Barack Obama’s second term in the next presidential contest elected Donald Trump, whose anti-immigration positions were central to his political rise.
The shift within the Republican Party has been especially dramatic. Following Obama’s victory in 2012, the Republican National Committee “autopsy” report blamed anti-immigrant rhetoric for a failure to win over more Hispanic voters and, in a rarity for a document produced by a political organization, pushed for a change in party policy on immigration.(i) Fourteen Republicans would vote for the Senate’s 2013 reform bill that included a pathway to citizenship for illegal immigrants.
With Donald Trump, Republican voters in 2016 went in the opposite direction. Hard-edged immigration proposals such as the border wall and a ban on Muslims entering the country were cornerstones of the Trump campaign in the primaries. To the surprise of many, Trump’s views did not seem to hurt him in the general election. Hillary Clinton won the Hispanic vote decisively, but she did no better than Barack Obama did four years earlier. Meanwhile, Trump increased his share of the vote among white working-class voters with more negative views of immigrants. While immigration was not the sole factor in their vote, demographic groups with more negative views of immigration proved far more decisive in the 2016 Electoral College battle, in contrast to what many experts had predicted.
Heading into the 2018 midterm elections, immigration is once again front and center. With a seven-country travel ban, the termination of Deferred Action for Childhood Arrivals (DACA), and since-reversed family separations at the border, President Trump has used executive actions to proactively shape immigration policy in the image of his campaign rhetoric.
The outcome of the 2016 presidential election and the ongoing debate in 2018 calls for a fresh look at the politics of the immigration debate. Democracy Fund Voter Study Group surveys since 2011 have measured American voter attitudes on immigration, with deeper inquiries about immigration in the 2017 and 2018 VOTER Surveys (Views of the Electorate Research Survey) as the issue gained prominence in the Trump era.
The state of public opinion is more nuanced than the pre-2016 conventional wisdom suggests. Voters continue to support a pathway to citizenship for illegal immigrants by large margins, and they support legal status for DREAMers by an even larger margin.(1) Voters overwhelmingly agree that legal immigrants contribute to American society, and they are evenly split on whether illegal immigrants do. But there are signs of unease about immigration in the data. According to the 2018 VOTER Survey, more Americans prefer a potential new third party to take conservative rather than liberal stands on immigration, there is greater appetite for reductions over increases in immigration levels, security-driven concerns about immigration run high, and more than 40 percent of respondents support a temporary ban on Muslim entry.
The immigrant story in America encompasses a multitude of experiences, from those here legally to those here illegally, from those who have lived in America for years to those who have just arrived, and from the tech startup founder to the migrant farm worker. It is not surprising that the American public would have distinct reactions to each of these scenarios with more sympathetic views in some circumstances and more skeptical ones in others.
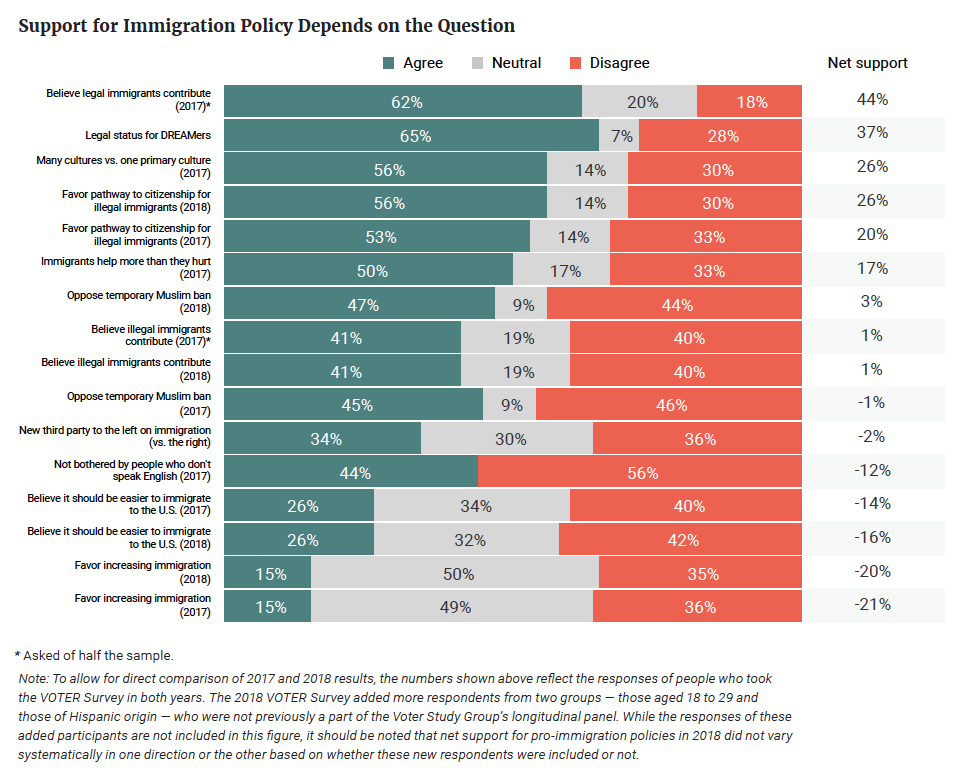
Both the 2017 and 2018 VOTER Surveys included expanded question batteries on immigration. The overall results of selected immigration policy questions are ranked from high to low net support of immigration (Figure 1).(2) Support is highest for the belief that legal immigrants contribute to American society and for letting DREAMers stay in the country. It is closely divided on the questions of a temporary Muslim ban and whether illegal immigrants contribute. On balance, support is lowest for expanding immigration levels.
(1) “DREAMers” refers to those immigrants who would be protected under the DREAM (Development, Relief, and Education for Alien Minors) Act, a legislative bill introduced in July 2017 but not passed by Congress. President Obama signed the executive order creating DACA as a temporary solution pending passage of the DREAM Act.
(2) Net support is defined as the percent difference between responses indicating a favorable view of immigration and those indicating an unfavorable view.
Figure 1
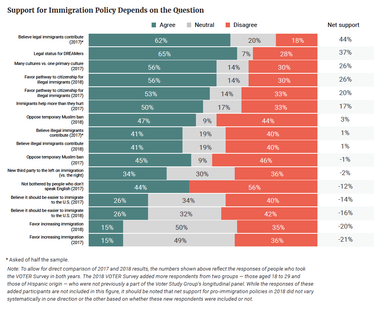
Table 1

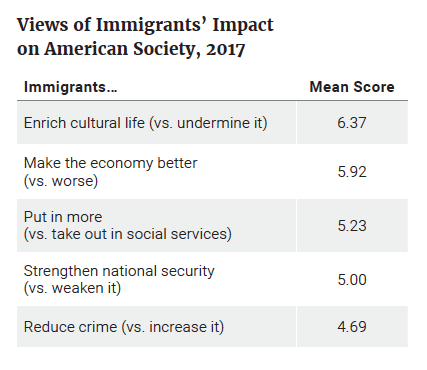
The 2017 VOTER Survey also asked respondents to rate immigrants’ impact on different aspects of American society, with 10 as the most positive rating and 1 as the most negative. Mean scores above 5 reflect a more positive assessment and those below 5 a more negative assessment of the immigrant population (Table 1). In 2017, immigrants were viewed as having a more positive than negative impact on culture and the economy. Perceptions of immigrants’ fiscal contribution were also slightly positive, associated more with working and paying taxes versus using social services. Voters had a neutral view of immigrants’ impact on national security and a net negative view of their impact on crime.
American public opinion is not consistently pro- or anti-immigration. Politically, no one side holds a decisive upper hand in the debate, which is characterized by varying reactions that are favorable to immigration in some circumstances and negative in others. Three factors seem to drive whether public opinion will ultimately lean in favor of or against immigration:
Legal over illegal immigration: Americans draw sharp distinctions between legal and illegal immigrants. In the 2017 VOTER Survey, respondents said that legal immigrants contribute to rather than act as a drain on America by a net 40-point margin, but they were nearly evenly divided on this same question when asked about illegal immigrants. This latter finding was repeated in the 2018 VOTER Survey. Other public polling data shows that the public switches from favoring reduced to increased immigration with the addition of the simple descriptive word “legal.”(ii)
Those currently here over those newly arrived: The American public prioritizes those already here — legally or illegally — over those who may come legally in the future. A pathway to citizenship for illegal immigrants and a resolution of DREAMer legal status garner broad support, with more than two-to-one majorities in 2018. Voters seem more cautious in hypothetical questions about those who have yet to come to the United States. A temporary Muslim ban still attracts significant support, and on balance, voters want to make it harder to immigrate to the United States. These attitudes suggest greater sympathy for immigrants already here regardless of legal status and more mixed views about those waiting to come here.
Hopeful about culture and the economy but uncertain on security: Americans believe that immigrants enrich our culture and the economy, but they are more likely to think immigrants have a mixed impact on national security and crime. The most sharply negative views appear on crime despite statistics that show that immigrants commit less crime than native-born Americans. Nonetheless, safety and security concerns about immigration have traction, and these are the themes President Trump and immigration critics have used most doggedly.
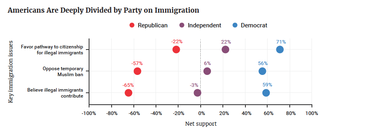
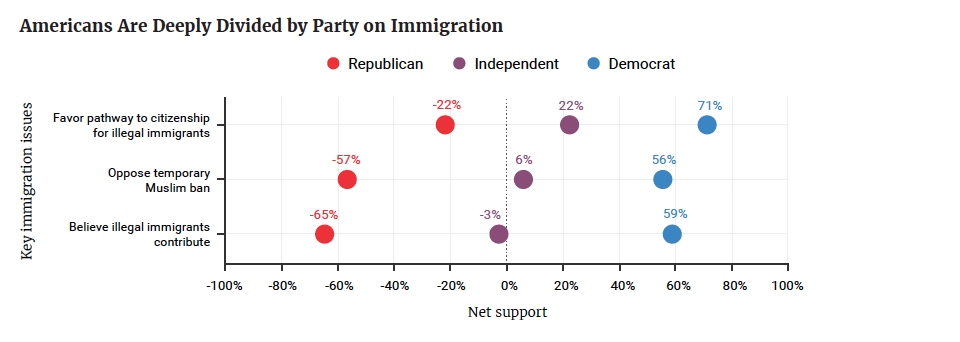
Americans’ views of immigration almost perfectly mirror the country’s partisan divide, a trend that has accelerated in Voter Study Group data since the 2016 presidential election. Except for one question measuring views of N.F.L. players kneeling for the national anthem, no issue question in the 2018 VOTER Survey was more closely correlated with party identification than the question of whether illegal immigrants “mostly make a contribution” to American society (with 44 percent support) or are “mostly a drain” (37 percent). There were few dissenters from dominant party views on this question: Democrats largely believed that illegal immigrants “mostly make a contribution” (69 percent) instead of “mostly a drain” (12 percent), while Republicans answered in similarly lopsided fashion saying that they are “mostly a drain” (72 percent) versus “mostly make a contribution” (9 percent).
Figure 2
To better understand overall patterns of opinion, we developed an index to score survey respondents from 0 to 100 on their support for immigration, based on their answers to questions that presented them with a choice either more in favor of or more opposed to immigration.(3) The mean score across all respondents in 2018 was 54, indicating a closely divided electorate that leans in a pro-immigration direction. Visualizing these scores by party and ideology gives us a view of starker political divisions on immigration.
(3) Our scoring index includes questions about the following topics, with the response associated with the pro-immigration side of the debate in parentheses: Immigrants’ net contribution to American society (make a contribution), Provide a legal way for illegal immigrants to become U.S. citizens (favor), Easier or harder for foreigners to immigrate (easier), Temporarily ban Muslims from entering the U.S. (oppose), Allow young people brought to the U.S. illegally as children to stay and work legally (favor), Overall number of immigrants allowed in legally (increase), Positioning of new third party on immigration (to the left of Democrats). We assigned each question equal weight in the index, with the exception of half-weights given to two similar questions, about making immigration easier or harder and about overall immigration levels. Within each question, the highest score was assigned to the answer most supportive of immigration, with partial scores given to answers in the middle, and a zero given to the answer least supportive of immigration. The scores for each question were then added to form an overall index, normalized from 0 to 100.
Figure 3
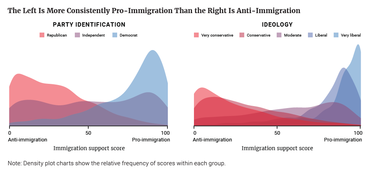
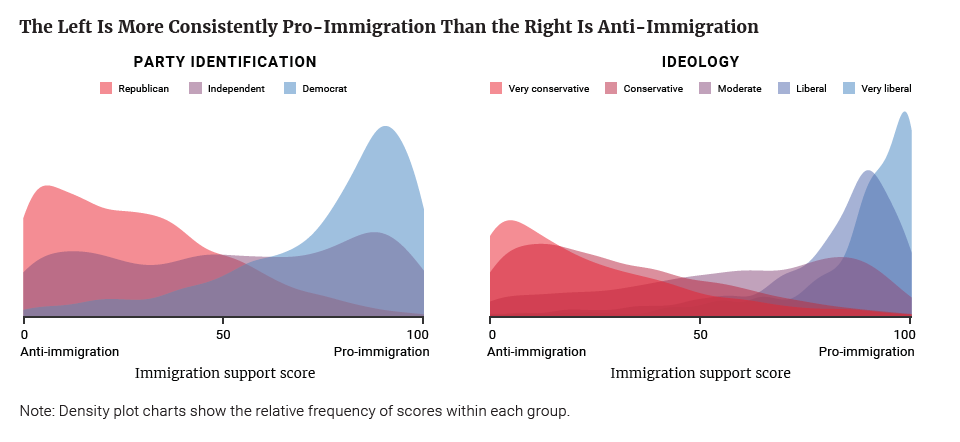
While partisan reactions seem to follow predictable patterns, support patterns on the left and the right are not exactly symmetrical. More Republicans differ from the dominant sentiment in their party on a pathway to citizenship for illegal immigrants and legal status for DREAMers, creating a more spread out pattern of support for Republicans. Democrats are more consistent on the issue: 65 percent of them scored as strong immigration supporters (with scores of 75 or above) compared to 56 percent of Republicans who are strong immigration skeptics (with scores of 25 or below). Fourteen percent of Republicans are scored as immigration supporters (with a score of 50 or higher) while 16 percent of Democrats are immigration detractors (scoring lower than 50).
While more Democrats are comfortable with their party’s views on immigration, many stop short of endorsing increased immigration levels. What accounts for the sharp blue “bulge” in the charts on support by party and ideology (Figure 3) are Democrats and self-identified liberals who are consistently pro-immigration but are comfortable with immigration levels as they are.(4) Only the very liberal group goes further, supporting increased immigration levels.
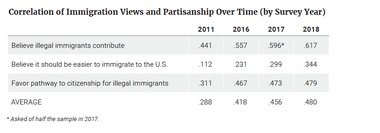
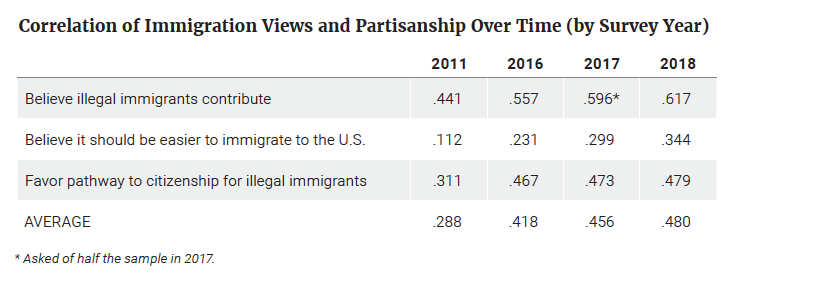
The partisan divide on immigration is not only wide, but it has grown wider in every year of the Trump presidency. Views of immigration were fairly correlated with partisanship in the first Voter Study Group survey in 2011. These partisan divisions grew considerably wider in the 2016 VOTER Survey and wider still in 2017 and 2018 VOTER Surveys. This is illustrated by the correlation coefficients between partisanship and responses to survey questions included in every wave of the VOTER Surveys (Table 2).
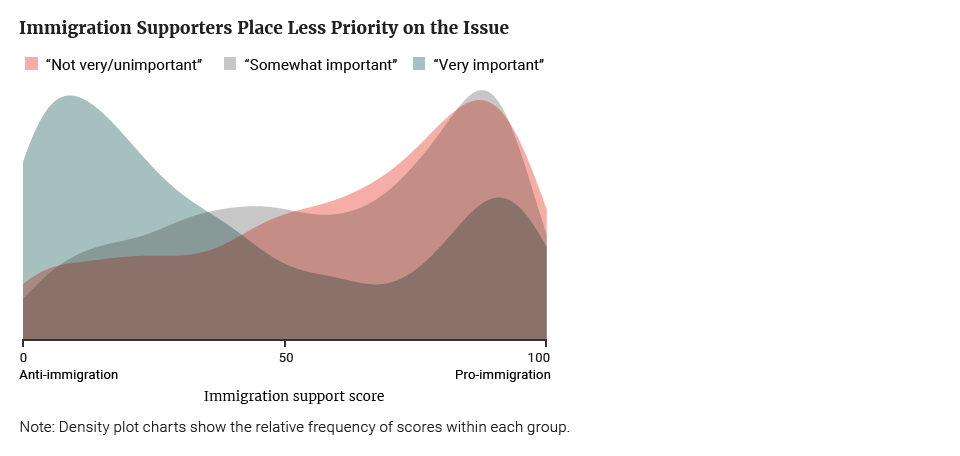
(4) By using a density plot — a variation of a histogram that uses kernel smoothing to plot values — we’re able to visualize where values are concentrated over the scoring index interval. This method allows us to better determine the distribution shape, which helps us make inferences about the overall electorate, based on a finite data sample.
Table 2
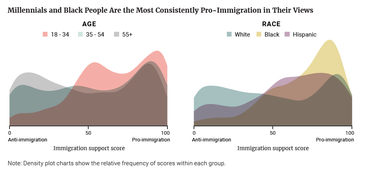
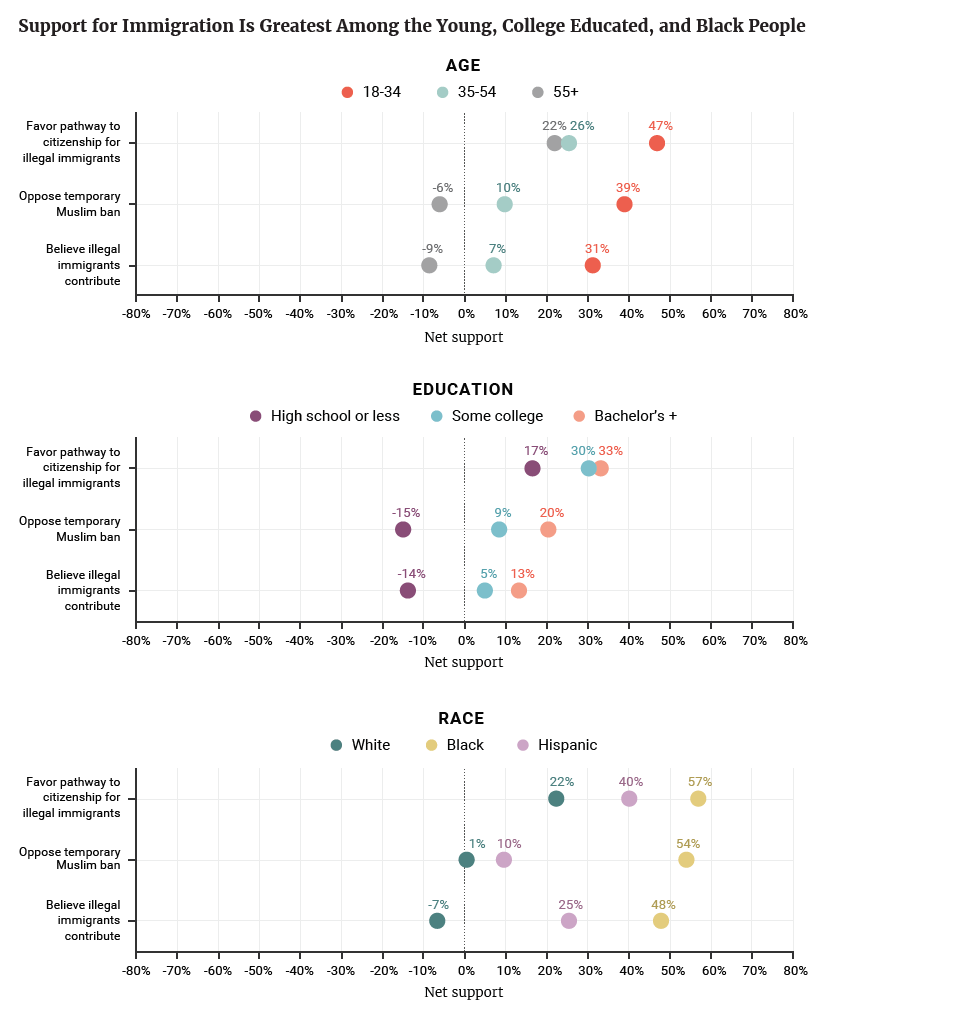
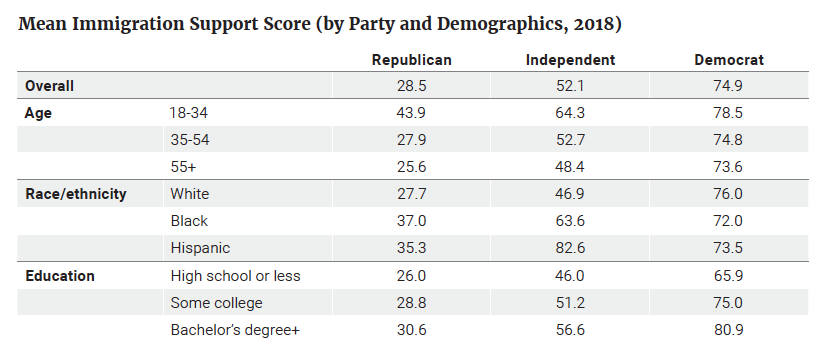
Political divisions are mirrored in generational, educational, and racial divides. The demographic groups that align more with the Democratic Party — including non-white people and younger voters — reflect the same pro-immigration sentiments as Democrats as a whole do, and of course, the reverse is true of Republicans. We see this in visualizing net support on key questions and in the distribution of immigration support scores across groups.
Figure 4
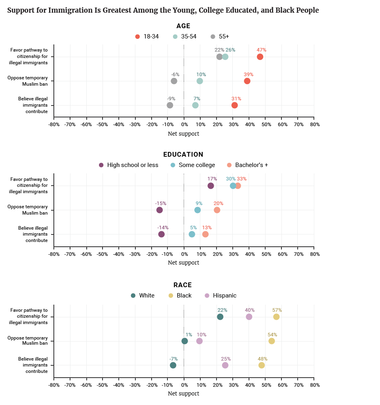
Figure 5
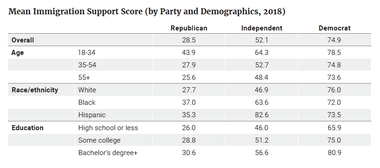
Of course, when we present data demographically, we run the risk of restating the same political divisions by another name. After all, demographic factors can help determine one’s politics. To control for these impacts, multivariate regression analysis was run that accounts for ideology, age, education, race, gender, and religion. The aim was to understand which of these factors are most significant as drivers of opinion on immigration.
Conducted across all immigration-focused survey questions, this analysis confirms the dominant role political attitudes play: Ideology was roughly six times as important as any other factor, and age and education play a further role in shaping opinion, with greater support among younger and more educated respondents. Surprisingly, race and ethnicity — and particularly Hispanic background — plays less of a role across the board, challenging the conventional wisdom that the issue of immigration is key to the Hispanic vote. Only on questions that center more on immigration from Latin America does being Hispanic seem to have an impact, but on broader measures, such as the overall importance of immigration as an issue, Hispanics answered no differently than others who leaned the same way politically.
The politics of immigration often plays out inside the parties more than between them. Building bipartisan coalitions requires understanding which groups are most likely to break from their party’s orthodoxy. The dividing lines on immigration within the major parties reflect overall trends in one key respect: Ideology remains influential, albeit less so given the more homogenous nature of each major party.
When it comes to demographic factors, however, there is an important difference in the nature of each major party coalition. Whereas education levels are more likely to predict whether a Democrat is more supportive of immigration, age is the key dividing line within the Republican Party. Republican 18- to 34-year-olds score 18 points higher than those 55 years and older in their support for immigration, compared to a 5-point gap among Democrats.
The trends within the Democratic Party are driven first by ideology, then by education levels with a 15-point gap in immigration support scores between the most- and least-educated Democrats (this gap among Republicans is 5 points). Views by race within the Democratic Party are more uniform with Democratic white people holding slightly more liberal views than Hispanics or black people. When we control for party affiliation, we once again see race playing only a modest role in predicting support for immigration.
Table 3
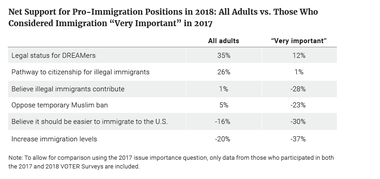
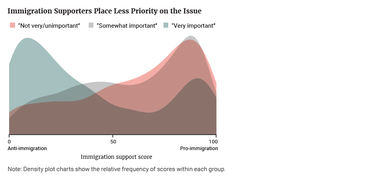
At times, the immigration debate can seem to be more dominated by the right than polling on some of the debate’s more pressing issues suggests. Voter Study Group data reveal a public that is closely divided on immigration in the aggregate, but the numbers look different for those who assign the highest priority to the issue. These voters lean further to the right, supported Donald Trump over Hillary Clinton by 21 points in 2016, and take a far more skeptical view of immigration.
The 2017 VOTER Survey asked respondents to rate their issue priorities. Overall, immigration ranked 16th out of 22 issues with 44 percent saying the issue was very important to them. But among Trump general election and primary voters, immigration was in 8th place, with 63 percent and 69 percent of Trump general election and primary voters respectively calling it “very important.” Among Clinton voters, only 29 percent said immigration was very important to them.
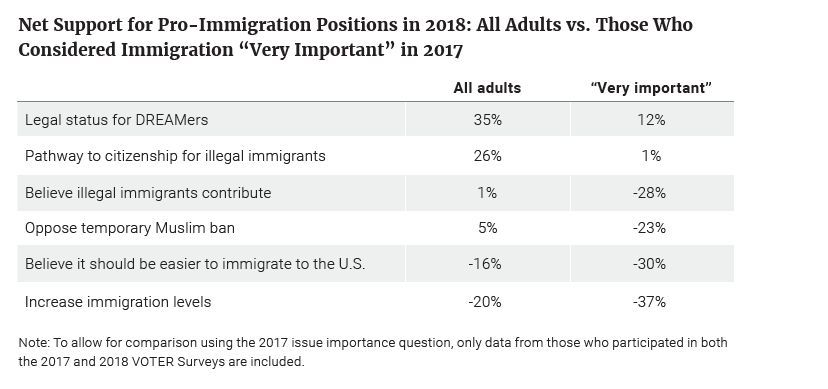
The partisan intensity gap has the predictable effect of shifting the balance of opinion sharply to the right among those who are most engaged on the issue. Among the sample of respondents who took both the 2017 and 2018 VOTER Surveys, support for the most popular pro-immigration priority, legal status for DREAMers, shrinks from a net margin of 35 points in favor to just 12 points in favor. Support for citizenship for illegal immigrants drops from a net margin of 26 points in favor to a net 1-point margin against. Issues including illegal immigrants’ contribution and a temporary Muslim ban, which divide voters overall, become two-to-one majorities for the “restrictionist” side among those who care the most about immigration.
Table 4
Overall immigration support scores yield the same conclusion. Just 35 percent of those who assign a very high priority to immigration are scored as immigration supporters (with scores of 50 or higher) compared to 61 percent of those who rate the issue as “somewhat important,” and 66 percent of those who rate the issue “not very” or “not at all important.”
The intensity gap is also reflected in another question, which asks whether respondents would like to see a potential new third party to the right or to the left on immigration. The results are a slight reversal in Democrats’ normal edge in party identification: 37 percent wanted to see a new party like the Republican Party or further to right of it on immigration, and 33 percent wanted to see a new party like the Democratic Party or further to the left of it, with the balance either unsure or wanting a new party to be somewhere in between the two major parties.
Figure 6
This relatively even balance changes when one looks at those who want a new party to be further out to the ideological extremes on immigration, with greater intensity on the side of those who want a political movement further to the right. More voters, 22 percent, want a new third party to be further to the right of today’s Republicans while 13 percent want a third party further to the left than today’s Democrats. Among Republicans, 49 percent want such a party to be more to the right on immigration than today’s G.O.P., compared to just 24 percent of Democrats who would like a party that is more to the left of their party. That is less than the share of Democrats, 36 percent, who would like a party that is more conservative on immigration than the Democrats today. This likely means that, while Democrats believe their party has gone far enough to the left (or perhaps even too far) on immigration, Republicans are open to seeing a further shift to the right. This is consistent with the higher level of urgency Republicans assign to immigration overall.
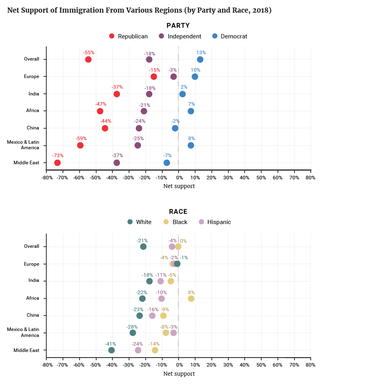
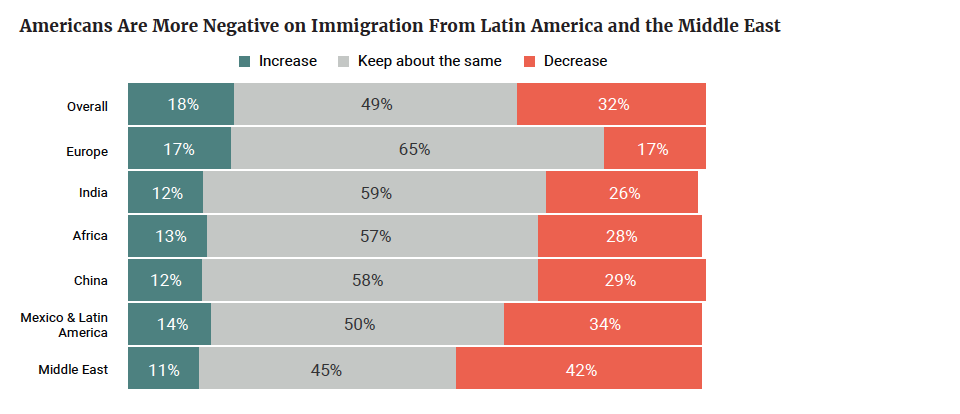
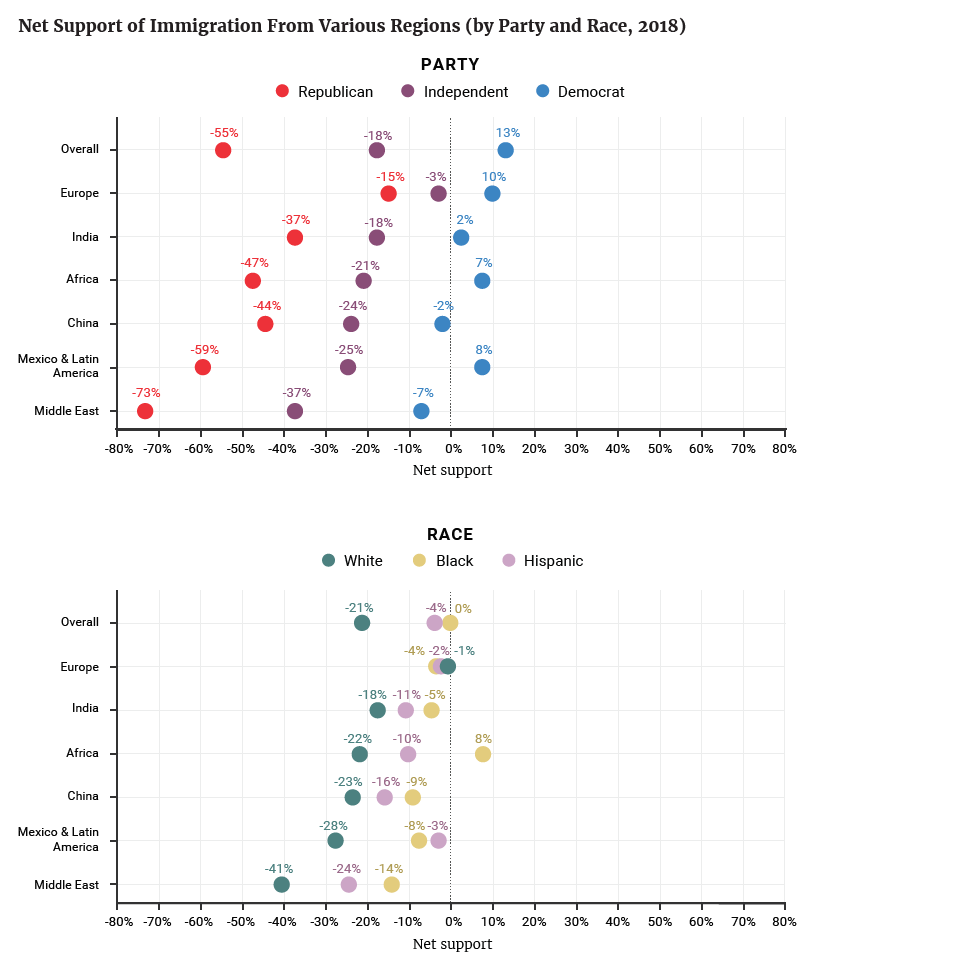
The 2018 VOTER Survey asked a series of questions on immigration levels from specific parts of the world. Most Americans are content to keep immigration levels steady, and this is also true when asked of immigration from different geographic regions. But the share of those who say they would like immigration decreased varies substantially depending on the region.
The survey asked about immigration from seven geographic regions: Europe, Mexico, and Latin America, the Middle East, Africa, India, and China. Results ranged from nearly equal numbers wanting to increase versus decrease immigration from Europe, to a nearly four-to-one ratio in favor of decreasing over increasing immigration from the Middle East.
Figure 7

Across geographic regions, the percentages favoring increased immigration are relatively small and fall in a narrow range, from 11 percent to 17 percent. But the percentages favoring decreased immigration vary considerably, Americans overall, and Republicans in particular, more likely to favor decreasing immigration levels from Latin America and the Middle East.
Subgroup support follows patterns we’ve seen so far, with partisanship dominating. But there is a key difference: Whereas race and ethnicity contribute relatively little to explaining views on immigration overall, they can play a role in views about immigration that is coming from groups of the same racial background of the respondent. White people, black people, and Hispanics are, on net, about ten points more likely to support increased immigration from Europe, Africa, and Latin America, respectively, than their normal support patterns for other groups would indicate.
Figure 8
The conventional wisdom about the politics of immigration has been shaken by the election of Donald Trump. Five years ago, Republican leaders were eager to have the issue go away because it was seen as a deal-breaker with the Hispanic vote. Today, illegal immigration is an issue trumpeted by a Republican White House and is perceived as key to motivating the party’s base in a challenging midterm election cycle.
Elites in both parties may have been overly optimistic about the prospects of immigration reform. They tended to see public support for a pathway to citizenship for undocumented immigrants as the final word on immigration. But immigration is a multifaceted issue. Safety and security concerns related to potential refugees were salient in the 2016 presidential primary campaign. Today, President Trump seeks to highlight any connection between illegal immigration and violent crime. And indeed, VOTER Survey data show that crime and national security are two of the areas where the public is less certain that immigrants are having a positive impact. While the public remains opposed to signature Trump policies like the border wall, President Trump has partly succeeded in reframing the broader debate from one of resolving the status of undocumented immigrants to one focused on national security and public safety.
Public opinion can seem paradoxical at times. The American public is sympathetic to illegal immigrants currently in the U.S., while at the same time showing near-plurality support for seemingly extreme positions, like a travel ban on Muslims, which, as worded, is unconstitutional religious discrimination. (To survive legal challenges, the Trump administration’s travel ban was fashioned as a ban against seven countries.)
These seemingly contradictory positions do have a certain inner logic: Integrating those already here (who people see as contributing to the culture and the economy), while at the same time slowing down the process for potential future immigrants. For Americans, this means making it more difficult on balance for people to immigrate, and showing a willingness to pick and choose the parts of the world from which immigrants to the U.S. can come.
Partisan fissures are the main factor driving Americans apart on immigration, and the parties seem destined to grow further apart on the issue for as long as it remains a defining feature of Donald Trump’s presidency. Beyond these partisan divisions, age, and education levels further shape public attitudes. Americans between the ages of 18 and 34 hold a distinctly positive view of immigration, a trend which holds true across racial groups, and they are not as divided on immigration by party. These Americans will make up a larger share of the electorate in years to come, but for now, they stand alone. On immigration, voters aged 35 to 54 are closer to older voters in their views than younger voters — and just as politically polarized.
Ironically, the growing diversity of the American electorate does not seem to be a main driving factor in increasing support for immigration. Attitudes on immigration cut across racial and ethnic lines, and are largely driven by partisanship, age, and education. If we are to see less partisan polarization on immigration in the future, it will be because of generational shifts and rising rates of educational attainment — trends affecting Americans of all racial and ethnic backgrounds.


Subscribe to our mailing list for updates on new reports, survey data releases, and other upcoming events.


