
White Backlash: Immigration, Race, and American Politics
Princeton University Press June 9, 2017
Elections, Race & Ethnicity, Religion, Socio-Economic
Key Findings
During the 2016 presidential campaign there was an intense debate both within the Republican Party and then between Donald Trump and Hillary Clinton about the nature of American identity — who we are as a country, and who we should be.
Trump announced his candidacy by declaring that Mexico was sending rapists to America and the country needed to build a wall to keep them out. His slogan — “Make America Great Again” — reminded some voters of what had been lost and how he would restore it. Trump emphasized keeping out people who he believed threatened the country or were not deserving of its spoils.
Clinton’s message, that we are “Stronger Together,” suggested that differences among Americans were an asset more than a threat. Clinton’s ads were filled with faces from diverse racial and ethnic backgrounds. Clinton welcomed and embraced some of the groups that Trump believed posed a risk.
In this essay, I investigate both the consequences of this debate for voter decision making in 2016 and the divisions both within and between the political parties over American identity after the election.
First, I show that prior to the 2016 campaign, there was an increasing alignment between race and partisanship. Among white people, there was an increasing division based on formal education. The party coalitions had shifted even before Trump’s candidacy.
Second, drawing on reinterviews of Americans originally interviewed in 2011 to 2012, I show that attitudes about immigration, feelings toward black people, and feelings toward Muslims became more strongly related to voter decision making in 2016 compared to 2012. None of the other factors that I examine show this pattern. The greater salience of attitudes related to race, ethnicity, and religion arguably derives from a campaign far more focused on immigration and the threat of terrorism than the 2012 campaign was.
Finally, I describe the contours of Americans’ opinions about key facets of the immigration debate. I show that Trump’s initial priorities of restricting immigration and fighting terrorism align very much with the priorities of Republican voters and especially his base of primary supporters. Moreover, there are large partisan cleavages in how Americans feel about both immigrants and Muslims, with Republicans and especially Trump primary supporters expressing less favorable views of these groups, on average.
On the more fundamental question of what American identity means, there is both consensus and disagreement. Large majorities of Americans in both parties agree that respect for American institutions, speaking English, and having American citizenship are important for being American, while a large majority rejects the ideal of citizenship based on European heritage. But there are larger partisan cleavages on the importance of being born in America and especially being Christian. Nearly two-thirds of Trump’s primary supporters believe being Christian is important to being American. This latter finding implies a continuing divide over whether members of minority religious faiths, and especially Muslims, can be fully American.
On the question of what a majority-minority nation will mean, Americans react with ambivalence. Many Americans see both potential benefits — a richer culture, more economic growth — but also potential costs, including a scarcity of jobs and additional demands on government services. In general, Democrats are more optimistic than Republicans, and the two parties are particularly divided on whether a more diverse country will place too many demands on government.
On the more fundamental question of what American identity means, there is both consensus and disagreement.
Prelude
The current alignment of race, attitudes related to race, and partisanship in U.S. politics
began to take shape in the Civil Rights era. But that alignment strengthened in the years
immediately before the 2016 election. This created even larger cleavages between white
people and nonwhite people but also a cleavage within white people based on education.
The “diploma divide” among white people so often attributed to the 2016 campaign was in
place before the campaign began in earnest.
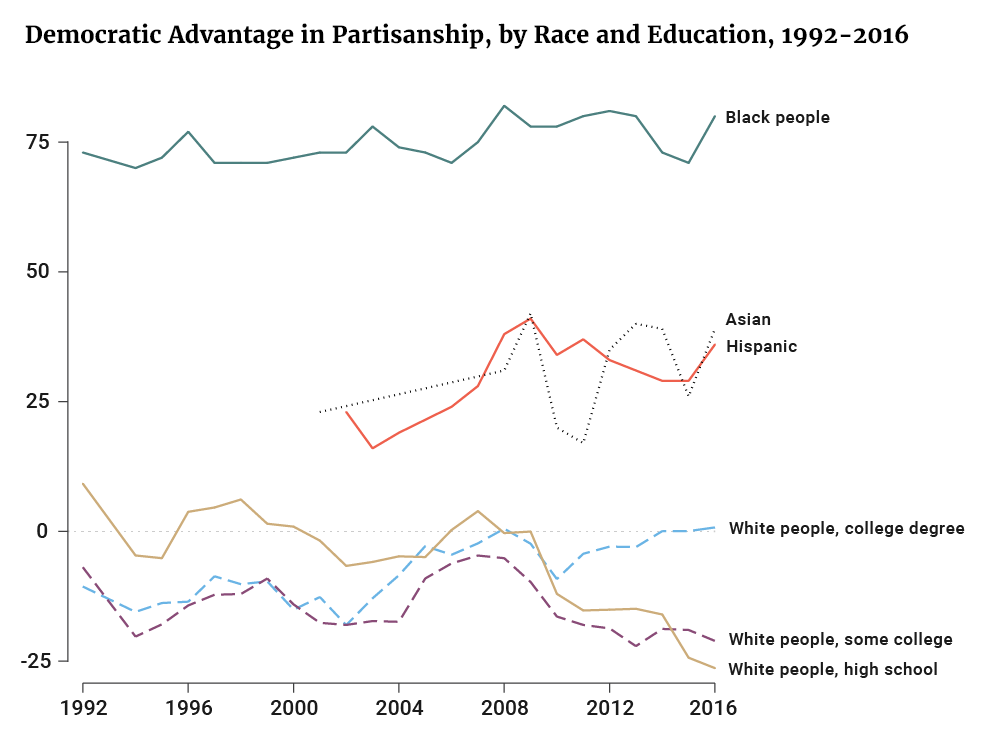
Consider the following data from Pew Research Center surveys. In this graph, positive
values signal a Democratic advantage in party identification, and negative values a
Republican advantage.
Figure 1
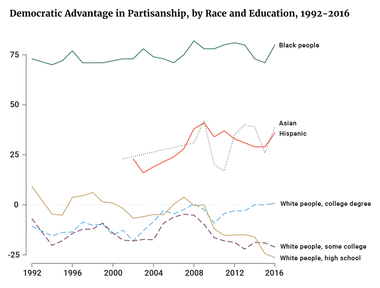
The Democratic Party has an increasing advantage among nonwhite people. Among Hispanics, Democrats outnumbered Republicans by 23 points in 2002 but 36 points in 2016. The trend among Asians is less consistent, but other data show their pro-Democratic shift: in exit polls, Asians’ support for Democratic presidential candidates increased from 31 percent in 1992 to 73 percent in 2012.(i) Black people also came to identify more strongly with the Democratic Party. The Pew Research Center data do not capture the strength of partisanship, but in the American National Election Study, the percentage of black people who said that they were “strong” Democrats increased from 31 percent in 2004 to 55 percent in 2012.
By contrast, the Republican Party has an increasing advantage among white people — an advantage that only developed after Obama took office. In Pew surveys from 2007, white people were just as likely to call themselves Democrats as Republicans (44 percent to 44 percent). By 2010, white people were 12 points more likely to be Republicans than Democrats (51 percent to 39 percent). By 2016, that gap had widened to 15 points (54 percent to 39 percent).
The figure shows that white flight from the Democratic Party occurred almost entirely among white people without a college degree. White people who did not attend college were evenly split between the two parties from 1992 to 2008. By 2015, white voters who had a high school degree or less were 24 percentage points more Republican than Democratic (57 percent to 33 percent). Meanwhile, college-educated white people moved toward the Democratic Party. This is the “diploma divide.”
A key reason for these trends is racial attitudes. The shifts among white people overall and white people without a college degree occurred mostly among white people with less favorable attitudes toward black people. No other factor predicted changes in white partisanship during Obama’s presidency as powerfully and as consistently as racial attitudes.(ii)
This alignment between partisanship and racial attitudes involved more than attitudes toward black people. By 2012, white Democrats and white Republicans diverged over whether they evaluated Muslims favorably and whether immigration should be restricted. Depending on the specific survey question, this divergence consists of Democrats moving toward more favorable attitudes, Republicans moving toward less favorable attitudes, or both. Some Americans may have even changed their partisanship based on their views of immigration.
Regardless, the result is the same: Democrats and Republicans in the electorate became more polarized in their views of immigrants and Muslims — again, before the 2016 campaign.(iii)
Then, from 2015 to 2016, a substantial part of the campaign centered on the racially and ethnically inflected issues that increasingly divided the two parties. Moreover, these issues were far more prominent than in 2012. Systematic data from cable network transcripts show that campaign-related stories that also mentioned immigration were far more prominent in 2016 than in 2012. For example, out of all CNN stories that mentioned the “presidential campaign,” the percent that also mentioned “immigration” or “immigrant” in a proximate sentence was 1.5 percent between June 2011 and October 2012, but 5 percent between June 2015 and October 2016.(1) The percent of campaign stories that mentioned “Islam” or “Muslim” increased from 0.5 percent to 2.6 percent over the same periods. In other words, the fraction of campaign news coverage that mentioned immigration increased more than three-fold, and the fraction mentioning Muslims increased more than five-fold.
A larger “dose” of information about issues such as immigration should have made voters’ own feelings about these issues more salient to their decision making about the candidates in 2016 compared to 2012. That is exactly what this project’s survey data show.
(1) These data come from a collaboration between GDELT and the Internet Archive: I first searched for all stories with the phrase “presidential campaign.” I then searched for all stories with “presidential campaign” and “immigration” or “immigrant.” This returns the number of stories that included “immigration” or “immigrant” within four sentences of “presidential campaign.” This provides an estimate of the percentage of presidential campaign stories that mentioned immigration.
In December 2016, the survey firm YouGov reinterviewed 8,000 respondents who had been interviewed originally in 2011 to 2012 as part of the Cooperative Campaign Analysis Project. In that survey, 45,000 respondents were first interviewed in December 2011 and were interviewed a second time in one of the 45 weekly surveys between January 1 and November 8, 2012. Finally, 35,408 respondents were interviewed a third time after the November election.
Thus, for these 8,000 respondents, we have measures of their political attitudes in 2011 as well as self reports of their turnout and vote choice in November 2012. In addition, YouGov was also able to supply data on their presidential primary vote preference as of July 2016 — for Democratic primary voters, their choice between Bernie Sanders and Clinton, and for Republican primary voters, their choice among Trump, Marco Rubio, Ted Cruz, and John Kasich.
This unusual dataset has several key advantages. First, we do not have to rely on people’s potentially faulty memories of their prior attitudes or candidate preferences in either 2012 or the 2016 primary election. We know what those attitudes and preferences were at those times. Second, by reinterviewing respondents from 2012, we can explicitly track changes within individual respondents — such as a shift from voting for one party’s candidate to the other party’s candidate. Traditional polls, which consist of one interview of a single cross section at a single point in time, cannot do this.
Finally, and perhaps most importantly, we can better assess which factors truly affected people’s primary and general election candidate preferences in 2016. Traditional polls confront a profound challenge: we do not know if a correlation between responses to two questions in that poll represents a causal relationship. For example, a Pew Research Center survey conducted in March 2016 found that 75 percent of Trump supporters believed that “life in America is worse today than it was 50 years ago for people like you.” How should that be interpreted? Did people come to support Trump because they had a preexisting dissatisfaction with “life in America?” Or, by the time of the VOTER Survey (Views of the Electorate Research Survey), about eight months after Trump entered the race, were people who decided to support Trump for other reasons simply able to voice sentiments that were consistent with his message? If so, then dissatisfaction with “life in America” was potentially as much, if not more, a consequence of Trump support than a cause.
More generally, both anecdotal evidence and political science research show that people often change their attitudes to “match” those of the candidate they support. The attitudes most susceptible to change are those that are not strongly held or are particularly vulnerable to partisan and other biases. For example, people’s perceptions of the economy depend a great deal on their partisanship. In the 2016 election, perhaps the most famous examples of partisans changing their minds to match the messages they were hearing concerned attitudes toward Vladimir Putin and Wikileaks.(iv) For these reasons, we should be very cautious about election interpretations that depend solely on a single cross sectional poll, including the Election Day exit poll.
Our data, however, are less vulnerable to this problem. By relying on attitudes measured well before the 2016 election, we are better able to determine potential driving factors for voters in this recent election.
One disadvantage of the VOTER Survey, however, is that the large majority of respondents reported being registered voters and reported voting in the 2016 election. This is a function of at least two factors. One is the well-known tendency of survey respondents to over report socially desirable behaviors like voting in elections. A second is that the respondents most available and willing to be reinterviewed disproportionately report being registered to vote. Even with sample weights applied, approximately 93 percent of the sample reported voting in the 2016 general election. The very high rate of self-reported turnout means that this is not a useful survey for examining the decision to turn out.
Another disadvantage of the VOTER Survey data is that we do not have any interviews from 2013 to 2015. We cannot speak to how attitudes were changing during this period, and we should not mistake changes between 2012 and 2016 for changes that occurred in 2016. At least some of what we observe, such as the migration of white people without any college education to the Republican Party, mainly occurred from 2009 to 2015. It was not a consequence of the 2016 campaign.
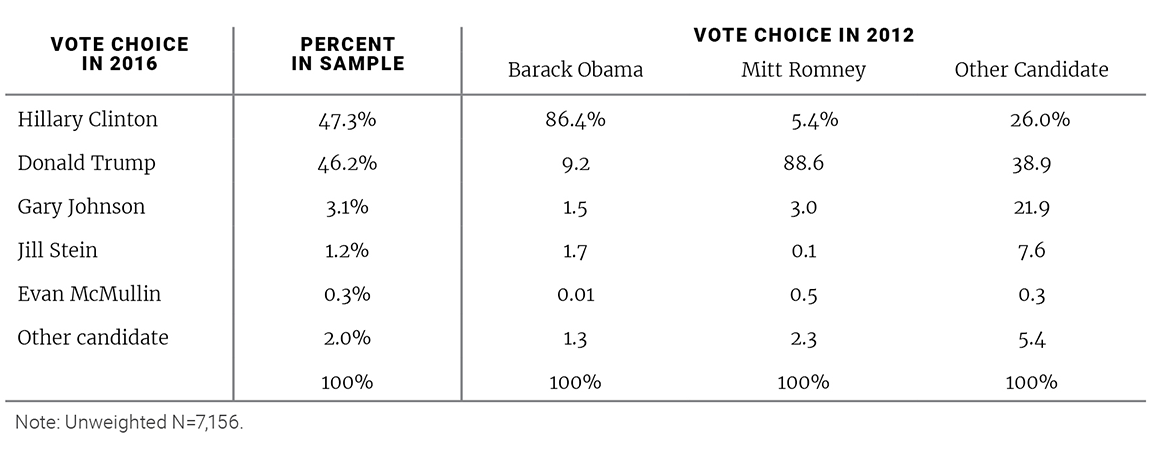
For 7,156 respondents, we have a reported vote choice in both election years. The table below shows the breakdown of the 2016 vote among voters who supported Obama, Romney, or another candidate in 2012.
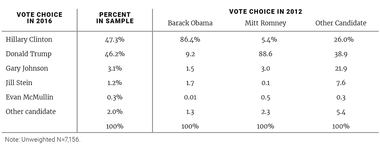
Overall, the distribution of the 2016 vote corresponds closely to the election results. It underestimates Clinton’s share of the vote slightly (47.3 percent vs. 48.0 percent) but is within a couple tenths of a point of Trump’s, Gary Johnson’s, Jill Stein’s, and Evan McMullin’s. The percentage selecting another candidate (2 percent) is higher than the percentage who indicated or wrote in another candidate (1.1 percent).
Among 2012 voters, there was a substantial and unsurprising degree of partisan loyalty: about 86 percent of Obama voters voted for Clinton and almost 89 percent of Romney voters voted for Trump. Thus, Romney voters appear slightly more loyal to their party’s candidate than Clinton voters. Among Obama voters who did not vote for Clinton, the largest share (9 percent) voted for Trump. The remaining voters were evenly distributed among Johnson, Stein, and other candidates. Among Romney voters who did not vote for Trump, the largest share (5.4 percent) voted for Clinton, while 3 percent voted for Johnson, 0.5 percent for McMullin, and most of the remainder for some other candidate.
Altogether, approximately 83 percent of voters were “consistent” partisans — that is, they voted for the same major party’s candidate in both years. This level of consistency from one presidential election to the next is typical. For example, among respondents who reported a vote for president in 2008 and 2012 in the Study of Citizens and Politics, 80 percent were consistent partisans. About 87 percent of McCain supporters voted for Romney, and 89 percent of Obama supporters in 2008 voted for him in 2012.(2) The 2016 election did not create more instability, in the aggregate, than others. The demographic factors correlated with switching one’s vote between 2012 and 2016 are intuitive. For example, among Obama voters from 2012, defections to a candidate other than Clinton were more prevalent among white people and especially white people without any college education. Among white Obama voters with at least some college education, almost 90 percent voted for Clinton. Among those with a high school degree or less, only 74 percent voted for Clinton and 22 percent voted for Trump. Education also affected the likelihood of switching among white Romney voters. About 92 percent of white Romney voters with a high school degree or less voted for Trump, compared to about 85 percent of those with at least some college education.
Of course, demographic correlates are often just proxies for other factors. It is therefore important to account for the political attitudes that may have driven partisan defections.
(2) These statistics are based on 2,046 respondents in the GfK Knowledge Panel and were provided by Dan Hopkins. Earlier panel surveys conducted by the American National Election Study show that the percentage of voters who were consistent partisans was 85 percent from 2000 to 2004, 77 percent from 1992 to 1996 (including Perot as a choice in both years), 72 percent from 1972 to 1976, and 76 percent from 1956 to 1960.
One important goal of this analysis is to identify factors that were uniquely powerful in 2016 compared to 2012. Simply trying to determine, say, which factors led Obama voters to vote for Trump does not speak to this question. It is possible that many of these factors are routinely associated with shifts from presidential election to presidential election.
Instead, what I investigate is this question: which factors became more strongly or weakly associated with people’s choices in 2016 compared to 2012? The advantage in our data is that we can measure these factors as of December 2011. Thus, we are avoiding the possibility that people changed their attitudes to match their candidate preference — a real possibility if we relied on measures of these factors from 2016 and especially a post-election survey.
I focus on voters who voted for either Romney or Obama in 2012 and then Trump or Clinton in 2016. This eliminates the small number who reported not voting as well as those who reported voting for a third-party candidate. I also focus on white voters exclusively. Shifts in vote choice among white voters were the most consequential in 2016.
I estimate the impact of these factors from the December 2011 baseline survey:
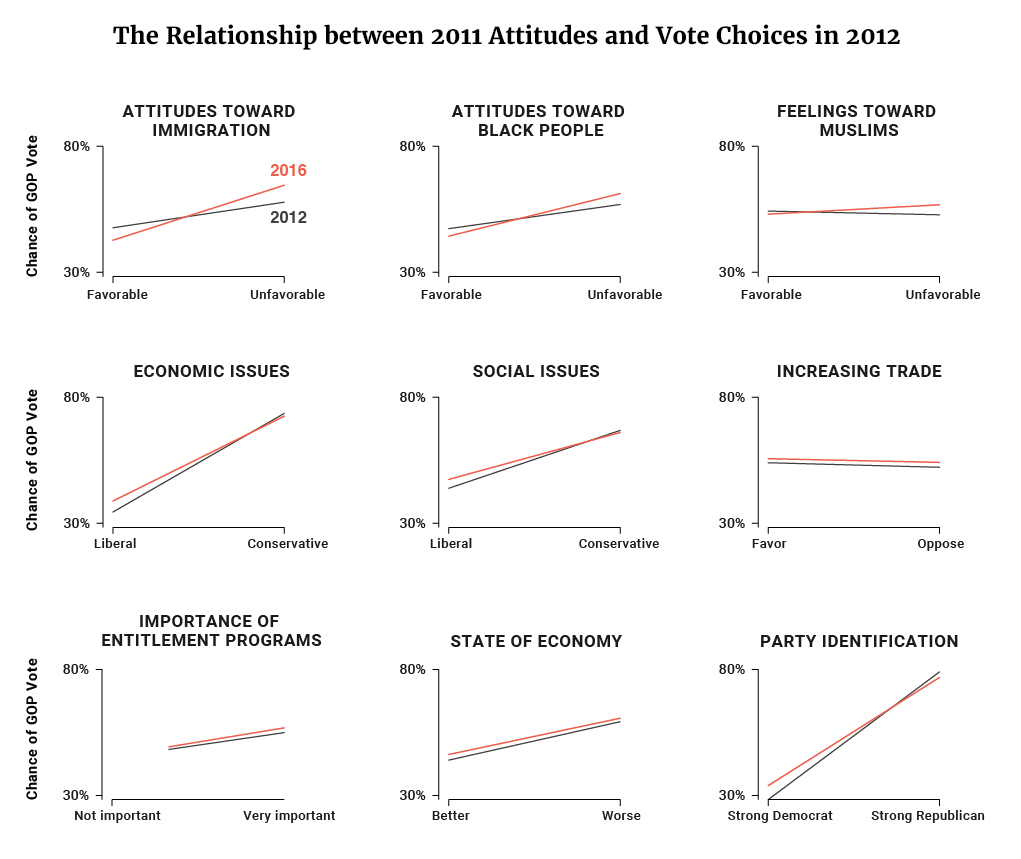
Figure 2 below shows the relationship between each factor and the probability of voting for Romney in 2012 and for Trump in 2016. This is based on a statistical model accounting for all factors simultaneously. Thus, each graph in the figure represents the relationship for one factor while “controlling” for all the other factors.
The results are striking first for what they do not show. For one, although Trump was often described as “populist” on social welfare policy because he stated he would not cut Medicare or Social Security, the importance attached to entitlement programs did not become more strongly associated with vote choice in 2016.
Second, after accounting for other factors, there is no statistically significant relationship between trade attitudes and vote choice in either election. Other surveys show that in 2016 opposition to trade agreements increased significantly among Republicans but not Democrats, suggesting that Republicans were mainly echoing sentiments they were hearing from Trump.(4) If so, then trade attitudes are more consequences than causes of partisanship or vote choice.
(3) The four items ask how much respondents agree or disagree with these statements: “Over the past few years, black people have gotten less than they deserve”; “Irish, Italian, Jewish, and many other minorities overcame prejudice and worked their way up. Black people should do the same without any special favors”; “It’s really a matter of some people not trying hard enough; if black people would only try harder they could be just as well off as white people”; and “Generations of slavery and discrimination have created conditions that make it difficult for black people to work their way out of the lower class.”
Figure 2
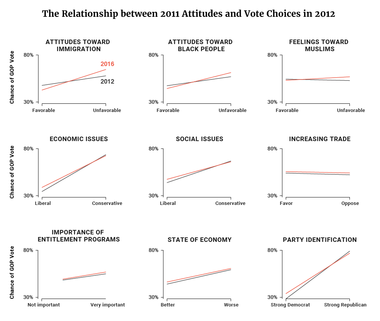
Third, although perceptions of the economy are related to vote choice in both years — unsurprisingly, people who believed the economy was doing worse were more likely to vote for the out-party Republicans — its effect is similar in both years. This suggests that the 2016 vote choice was not uniquely about “economic anxiety.”
The results also show that certain factors were less strongly related to voters’ choice in 2016 than they were in 2012: social issue attitudes, economic issue attitudes, and, more notably, party identification. The smaller impact of party identification reflects the larger number of defections in 2016, as compared to 2012.
What stands out most, however, is the attitudes that became more strongly related to the vote in 2016: attitudes about immigration, feelings toward black people, and feelings toward Muslims. This pattern fits the prevailing discourse of the two campaigns and the increased attention to issues involving ethnic, racial, and religious minorities in 2016.(v)
What stands out most, however, is the attitudes that became more strongly related to the vote in 2016: attitudes about immigration, feelings toward black people, and feelings toward Muslims.
The increased salience of these attitudes was particularly helpful for Trump because there were a substantial number of white Obama voters who as of late 2011 had less favorable attitudes toward black people, Muslims, and immigrants. For example, 37 percent of white Obama voters had a less favorable attitude toward Muslims (a feeling thermometer score on the “cooler” side of the scale). Similarly, 33 percent of white Obama voters said that “illegal immigrants” were “mostly a drain,” compared to 40 percent who said that they “mostly make a contribution” (the rest said “neither” or were not sure). About 34 percent said that it should be harder “for foreigners to immigrate to the United States,” while just 33 percent said it should be easier and 21 percent said there should be no change. By comparison, only 6 percent of white Romney voters thought illegal immigrants make a contribution to American society; the vast majority, nearly 80 percent, thought that these immigrants were a drain. Obama also won votes from some white people with unfavorable views of black people.(vi)
Of course, the trends in party identification after the 2012 election suggest that some of these white Obama voters may have shifted to identifying with the Republican Party before 2016. Regardless, the political consequences in 2016 were the same: a segment of white Democrats with less favorable attitudes toward these ethnic and religious minorities were potential or actual Trump voters.
Although many accounts of the 2016 campaign focused on white people without a college education, the salience of attitudes related to ethnicity and religion was not limited only to that subset of white people. Among white people with and without a college degree, attitudes toward both immigrants and Muslims had a stronger impact in 2016 than in 2012. There is some evidence that racial attitudes were activated more among white people without a college degree than white people with a college degree. If anything, economic perceptions were activated more among white people with a college degree, suggesting that “economic anxiety” was a less salient feature of decision making among noncollege white people in 2016 compared to 2012.
In the immediate aftermath of the election, there was much debate about what direction Trump would take as president and whether he would follow through on his campaign promises. Based on his first months in office, Trump has acted like most presidents: he has tried to keep his promises. In particular, he has prioritized the issues of immigration and terrorism by seeking to restrict immigration from Muslim-majority countries, suspend the admission of refugees, and empower federal authorities to seek out and deport undocumented immigrants.
The VOTER Survey is well suited to describe where the two parties stand on the complex set of issues that travel under the banner of “immigration.” In the December 2016 interview, we asked a battery of questions that not only speak to aspects of immigration policy, but also to how Americans feel about a country that is increasingly nonwhite as well as what they see as important to American identity. Because these data were gathered after the election, they do not provide unambiguous causal explanations of how people made choices in November. But they do show us where Americans stand as the Trump presidency was about to begin.
Given that Trump has placed immigration and terrorism at the top of his political agenda, it is important to ask: how does this compare with what the public wanted, at least as of December 2016? The VOTER Survey asked respondents about the importance they attached to a long list of issues, including immigration. To identify any cleavages both between and within the parties, I compared Democrats to Republicans as well as the primary supporters of Trump. This helps illustrate whether Trump’s “base” differs from other Republicans. Again, measures of primary vote preference are from July 2016, so they are less subject to misreports and flawed memories than if we had asked about the primaries in December 2016.
Figure 3
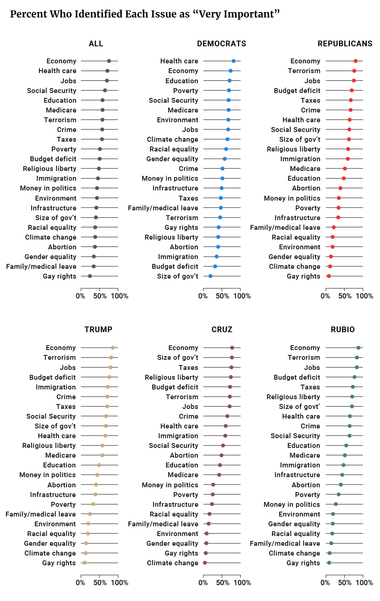
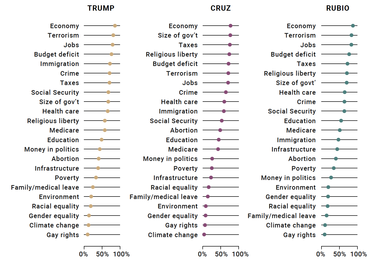
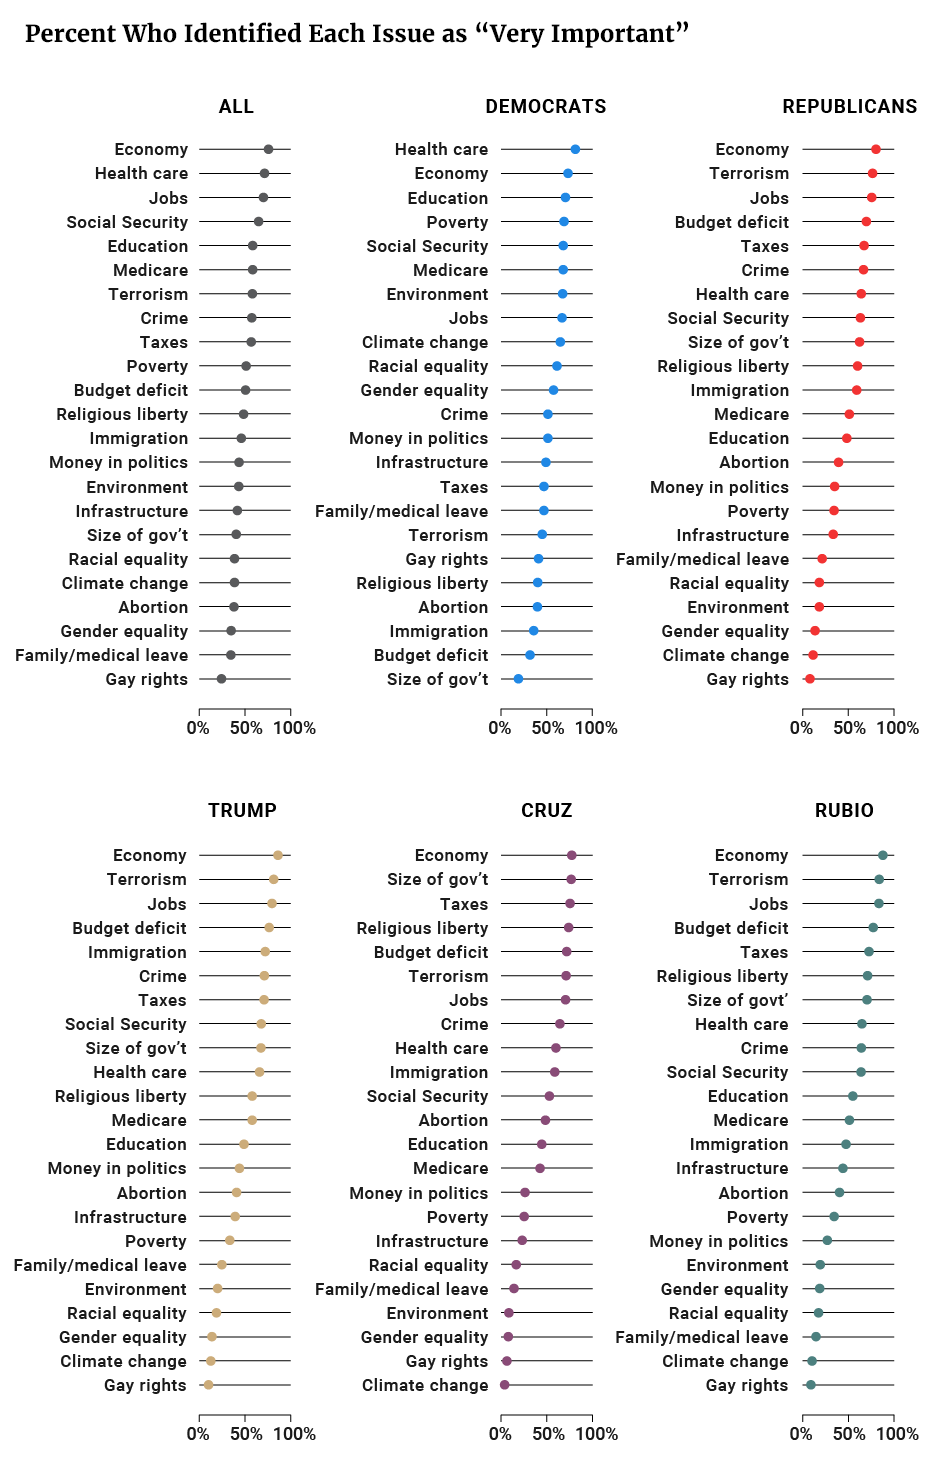
Figure 3 focuses on the percent who identified each issue as “very important” on a four-point scale. Immigration and terrorism ranked as very important to about half of respondents — 58 percent considered terrorism very important and 46 percent considered immigration very important — but these two issues ranked below top priorities like the economy (76 percent), health care (71 percent), and jobs (70 percent). There was a notable partisan cleavage, however. Democrats ranked both immigration and terrorism lower than did Republicans: only 45 percent of Democrats thought terrorism was a very important issue, compared to 76 percent of Republicans. Only 36 percent of Democrats thought immigration was a very important issue, compared to 59 percent of Republicans.
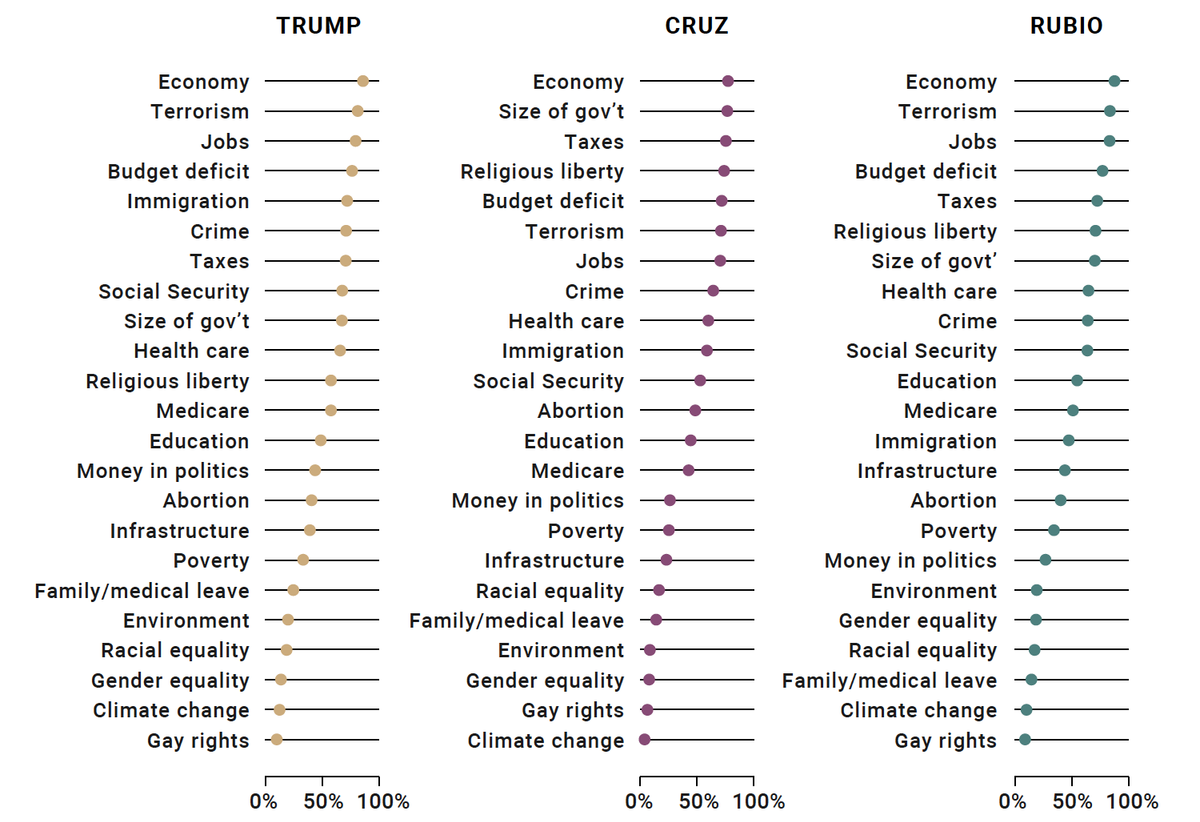
Trump’s focus on terrorism and immigration is even more in line with his base of primary supporters. A full 81 percent of his supporters said terrorism was very important and 72 percent said immigration was very important. Those issues were less of a priority for Cruz supporters. And while terrorism was a high priority for Rubio supporters, immigration was not. Trump primary supporters were distinctive in that they saw both issues as high priorities. Of course, they may have prioritized these issues precisely because they absorbed the Trump campaign’s messages. Regardless, Trump’s initial agenda is consistent with that of his base.
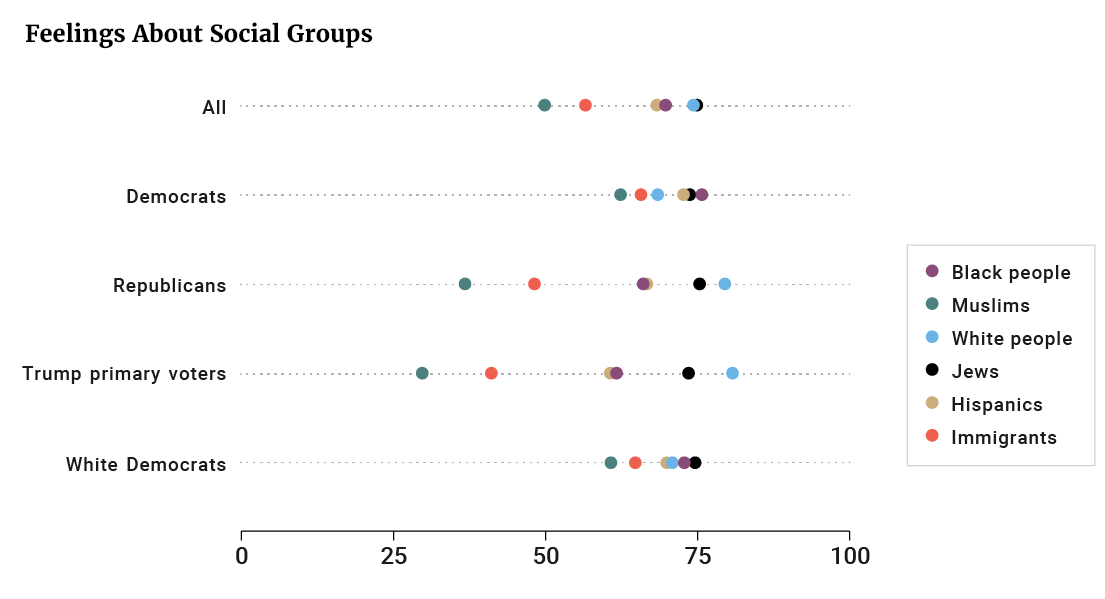
If these early Trump initiatives are focused on certain groups of immigrants, it is important to understand how Americans see these groups. Americans’ attitudes toward specific public policies are often tied to how they view the groups that those policies primarily affect. The VOTER Survey asked respondents how they felt about various demographic groups on a 0 to 100 scale, where 100 represents the most positive feeling.
Figure 4
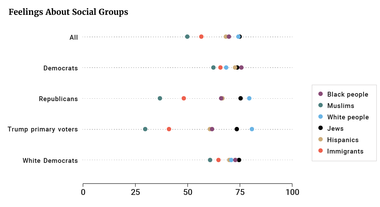
Figure 4 compares six of these groups: white people, black people, Hispanics, Muslims, Jews, and immigrants. Respondents generally rated white people, black people, Hispanics, and Jews favorably — although white people and Jews were evaluated about 8 to 10 points more favorably than black people or Hispanics. Muslims and immigrants were rated less favorably, however, with average feeling thermometer scores of 46 and 54, respectively.
Among Democrats, there was less differentiation among these groups, especially because Democrats viewed Muslims and immigrants relatively favorably. But among Republicans and Trump primary voters, there was more differentiation. Republicans and Trump voters evaluated white people about 11 to 12 points more favorably and black people and Hispanics about 10 to 14 points less favorably than did Democrats.(5) This may reflect the fact that people tend to rate their own racial or ethnic group more favorably than other groups, and white people are more prevalent among Republicans and Trump voters while black people and Latinos are more prevalent among Democrats. At the same time, the views of white Democrats are more like the views of all Democrats than to the views of Republicans, suggesting that the racial composition of the parties cannot itself account for these findings.
Republicans and Trump primary voters also had less favorable views of Muslims and immigrants. Among Republicans, the average rating of Muslims was 36 and the average rating of immigrants was 47. Among Trump primary voters, these figures were even lower: 29 and 40, respectively.
Of course, feeling thermometers are crude measures. They are useful for comparing how people feel about different groups but less useful for identifying nuances in their feelings. Thus, although Trump’s early initiatives focus on groups that many Republicans and Trump primary voters viewed unfavorably relative to other groups, this does not imply that they would view all individual Muslims or immigrants in the same way. But if policies are framed in terms of broad categories of groups, rather than making distinctions within them, then evaluations of these broad categories will be relevant to how the public thinks about these policies.
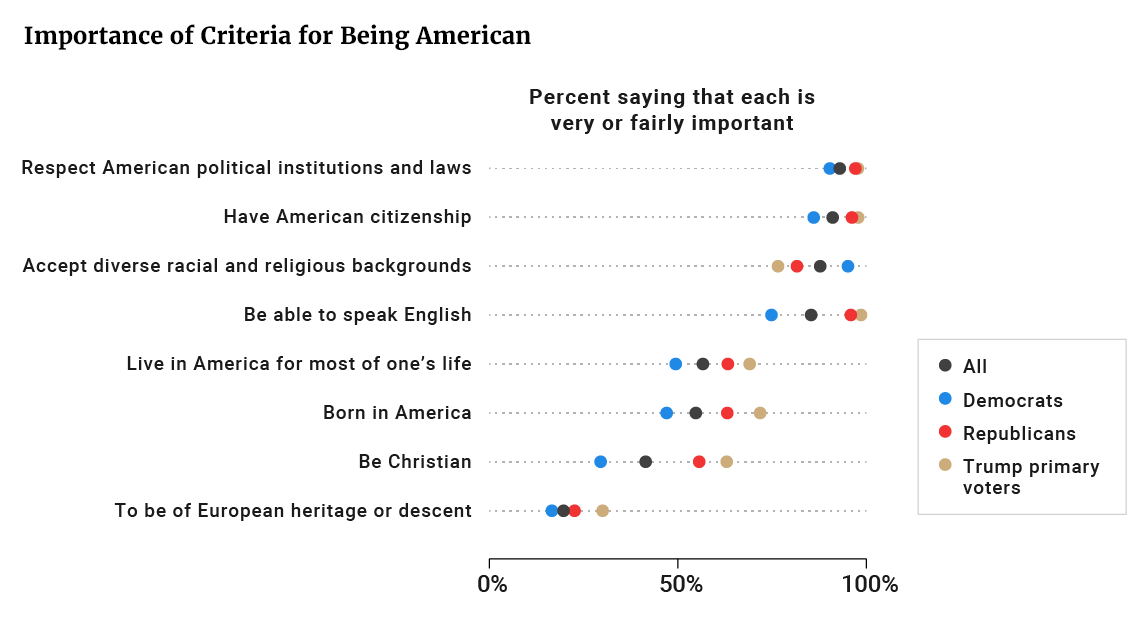
The debate about immigration is not just about specific groups of immigrants. It is a debate about how and whether those immigrants can fully be a part of American society and culture — and, indeed, what constitutes the very category “American.” The VOTER Survey includes a battery of questions that have been part of the General Social Survey for many years. The battery asks about the importance of various factors to “being truly American.” These factors speak to two conceptions of American citizenship — a “civic” conception based on American ideals and institutions and a more “ethnic” conception based on blood and soil.
(5) Among Republicans, the average thermometer rating for white people was 79. Among Trump supporters, it was 81. Among Democrats, it was 68. The average thermometer rating for black people among these three groups was 65, 61, and 76, respectively. The average thermometer rating for black people among these three groups was 65, 61, and 73, respectively.
Figure 5
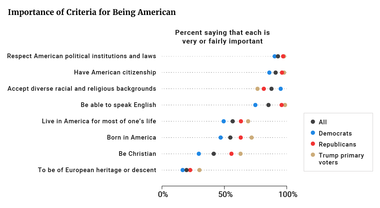
Figure 5 shows significant areas of consensus. Most Americans, including both Democrats and Republicans, said that three things are important: respecting American political institutions and laws, having American citizenship, and accepting people of diverse backgrounds. There was less consensus on speaking English, but majorities of both Democrats (75 percent) and Republicans (95 percent) still said this is important. On the opposite end of the spectrum, relatively few Democrats (16 percent) or Republicans (23 percent) said that it is important to be of European heritage.
However, nearly one-in-three (30 percent) of Trump primary supporters said that European heritage is important. Fewer supporters of other Republican primary candidates endorsed this criterion — 9 percent of Kasich supporters, 16 percent of Cruz supporters, and 22 percent of Rubio supporters. Trump primary supporters stood out in this respect, although again, a substantial majority still did not consider European heritage important to being American.
Substantial numbers of Americans...appeared to embrace a conception of citizenship predicated on birthplace and especially Christian faith.
There was less consensus, however, about three other criteria. About 63 percent of Republicans, and 69 percent of Trump primary voters, said that it is important to have lived in America for most of one’s life. Fewer Democrats (49 percent) agreed with this. Similarly, 63 percent of Republicans and 72 percent of Trump primary voters said that being born in America is important to being American. About 47 percent of Democrats agreed. Finally, there were larger differences in terms of whether being Christian is important: 30 percent of Democrats, 56 percent of Republicans, and 63 percent of Trump primary voters considered this fairly or very important. Substantial numbers of Americans...appeared to embrace a conception of citizenship predicated on birthplace and especially Christian faith.
Thus, substantial numbers of Americans, particularly among Republicans and Trump primary supporters, appeared to embrace a conception of citizenship predicated on birthplace and especially Christian faith. Both criteria polarized the parties more than any other, suggesting that the politics of immigration will remain fraught if the debate revolves around whether adherents of non-Christian religions — especially Muslims — can be truly American.
Although the Trump administration may be able to change immigration policy, this is unlikely to change the overall demographic trajectory of the country. Continued immigration as well as differences in birthrates mean that white people are still likely to become a minority in the United States within a couple of generations. How Americans respond to this transformation will have profound consequences for our politics.
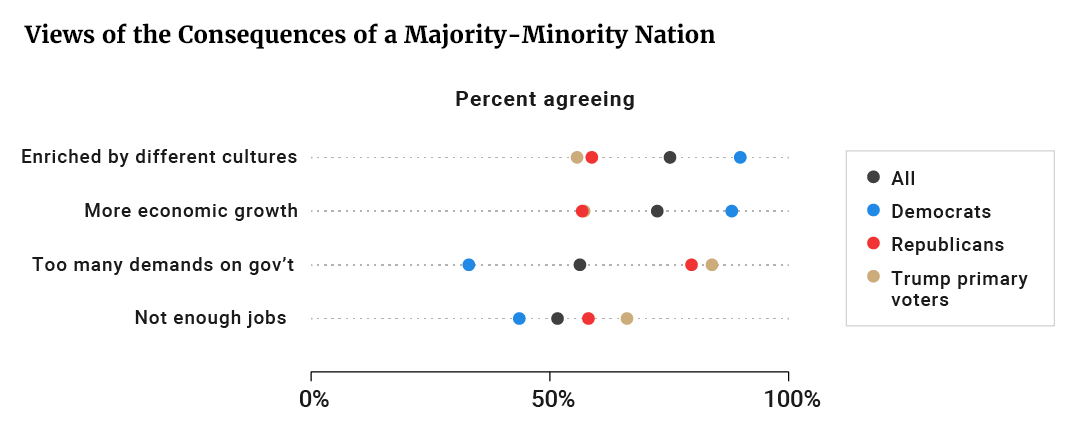
The VOTER Survey asked respondents about four potential consequences of these demographic changes:
Now, as you may know, census projections show that by 2043, black people, Latinos, Asians, and other mixed racial and ethnic groups will together be a majority of the population. Thinking about the likely impact of this coming demographic change, how much do you agree or disagree with each of these statements? • Americans will learn more from one another and be enriched by exposure to many different cultures. • A bigger, more diverse workforce will lead to more economic growth. • There will be too many demands on government services. • There will not be enough jobs for everybody.
Respondents were more optimistic than pessimistic: larger majorities agreed that demographic change would produce cultural enrichment (75 percent) and economic growth (73 percent) than agreed that there would be too many demands on government services (56 percent) or not enough jobs (52 percent). At the same time, that at least half of Americans agreed with each statement suggests ambivalence about the impact of these demographic changes.
Figure 6
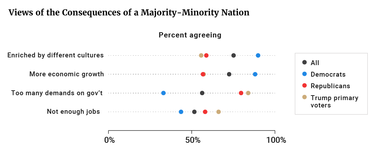
There were divisions between the parties: Democrats were more optimistic than Republicans, and Trump primary supporters were generally the least optimistic. For example, 59 percent of Republicans, compared to 89 percent of Democrats, thought that a majority-minority nation would enrich Americans by exposing them to different cultures. The largest difference concerned the potential demands on government services: only 33 percent of Democrats agreed with this, but 80 percent of Republicans and 84 percent of Trump primary voters agreed.
The varying opinions both within and across parties suggest that the politics of race and ethnicity in an increasingly diverse country are uncertain. One could imagine majorities, and somewhat bipartisan majorities, of Americans agreeing that diversity will bring benefits. At the same time, there are concerns and even the makings of a real battle about whether a more diverse country will place too many demands on government. That debate continues to play out regarding immigration, as critics of current immigration policy argue that immigrants often require too much in taxpayer-funded services.
Beginning with Obama’s election in 2008, many white voters left the Democratic Party. Of course, some white voters had already left the Democratic Party, particularly Southern white people. But there was still an abrupt change during Obama’s presidency, particularly among the white people without college education. As a result, the alignment between party and race had grown stronger even before Trump got into the race. The party coalitions were already changing.
The 2016 campaign then played directly on identities and attitudes related to race, ethnicity, and religion. This helps explain why a consequential number of white voters voted for Obama and then Trump, as well as why a smaller number of Republicans voted for Romney and then Clinton. Some of these changes may have reflected trends in the party coalitions before the 2016 campaign. However, the 2016 campaign arguably served to create additional shifts or to reinforce preexisting trends.
Ultimately, the 2016 campaign helped make attitudes related to immigration, religion, and race more salient to voter decision making in a way that many other attitudes were not. This was particularly consequential for Clinton because a substantial number of white Obama voters had less favorable views of immigrants, Muslims, and black people. Of course, these attitudes were not the only thing associated with how people voted in 2016. Moreover, the findings I have presented here characterize the entire sample of white voters; they are not an account of how any single voter, or every voter, made his or her choice. Nevertheless, these findings suggest that, compared to the 2012 election, the 2016 election was distinctively about attitudes related to racial, ethnic, and religious minorities.
What are the implications for a Trump presidency? Clearly, the parties continue to be divided about the importance of issues related to immigration and terrorism, as well as in their views of immigrants and Muslims writ large. Trump’s agenda as president, much like his campaign rhetoric, seem unlikely to serve as a unifying force — even if it is a unifying force within each party.
Ultimately, the 2016 campaign helped make attitudes related to immigration, religion, and race more salient to voter decision-making in a way that many other attitudes were not.
At the same time, Americans are not divided on every question related to American identity or our increasingly diverse nation. To most Americans, “Americanness” is more about what one believes than the place where one comes from. To most Americans, there will be benefits to a country that is ultimately more nonwhite than white. The question, however, is whether our politics plays on those areas where differences do remain — such as whether non-Christians can be fully American, and whether a diverse nation will place too many demands on government services.
Debates about how to create a “unum” from the “pluribus” are a fixture of American history. The 2016 presidential election and a Trump presidency seem likely to make those debates even more central to our politics.
Below are the estimates from the statistical models of vote choice. All variables are coded so that higher values equal more conservative beliefs, less favorable views toward black people and Muslims, more concern about the economy, and a stronger identification with the Republican Party. All variables are coded to range from 0 to 1.
I report least squares models separately for 2012 (1=Romney, 0=Obama) and 2016 (1=Trump, 0=Clinton), as well as a model that combines both years into a “change” variable where +1 is Obama-Trump, 0 is no change, and -1 is Romney-Clinton.


Subscribe to our mailing list for updates on new reports, survey data releases, and other upcoming events.
