
Opinion: Issues Matter in Elections Even More Than You’d Think
David Winston
Roll Call December 13, 2017

Key Findings
The 2016 presidential election was arguably one of the most unusual in American history. The two major political parties chose nominees whom the majority of the country viewed unfavorably. Neither political party had ever done this before, and in this election, both did. But it did not stop there. The significant scale of social media use and expansion, particularly by Donald Trump, changed the nature of political discourse during the campaign, as did the remarkably negative media stories about both Trump and Hillary Clinton. Those media stories included possible Russian involvement in the election, Hillary Clinton’s e‑mail server, the video-taped crude conversation between Billy Bush and Trump, and John Podesta’s internal campaign e‑mails, to name a few. From the electorate’s perspective, almost everyone was focused on everything but what voters wanted to talk about — the economy. Voters reached a point where they simply wanted the election to be over.
Many voters had a very unusual dilemma — how to choose between two people they disliked. This dilemma faced almost one in five voters, and not surprisingly, they found it a difficult choice, one that took them until late in the campaign to work through. Ultimately, they did, leading to another unusual outcome — the winner of the electoral vote lost the popular vote. While this had happened three times before, even this result was different from previous cycles. Clinton lost while having a 2.9 million vote advantage. Trump won doing something that the two previous Republican presidents had not been able to do. He won the key Rust Belt states of Michigan, Ohio, Pennsylvania, and Wisconsin. The last Republican to do that was Ronald Reagan in 1984, when he won 49 of 50 states, crushing Walter Mondale (who barely won his home state of Minnesota).
The fact that the Rust Belt provided the margin of victory has produced a very interesting backdrop for understanding how the country got to this outcome. While much of the campaign discourse was about scandals, Twitter statements, and the like, the electorate was feeling a profound sense of economic stagnation, particularly in the Rust Belt. While things weren’t necessarily getting worse, unchanging conditions were creating anxiety and frustration with voters believing the country was on the wrong track overall. Trump voters may not have agreed with all of his policy proposals, and Independents who supported him may not have agreed with much of what the Republican Party stood for, but they were looking for something radically different to change their economic situations. They believed that the current system inhibited both their security and advancement — they were clearly dissatisfied with the status quo.
Examining the motivations for their economic frustration has led to a variety of conclusions based on the demographic attributes of voters. This kind of analysis can be misleading because demographic groups do not exhibit monolithic behavior. According to the exit polls conducted by Edison Research, while Trump won men, 48 percent of them voted for someone else. While Clinton won women, 46 percent voted for someone else. While Trump won white voters, 43 percent voted for someone else. While Clinton won college graduates, 48 percent voted for someone else.
While voter decisions were certainly influenced by their demographic characteristics, their views on the issues and the priorities they assigned to those issues played a critical role.
In an environment of voter frustration, understanding how voters viewed the state of the country and which issues were most important are a central element in understanding what happened. Taking it a critical step farther, grasping what the issues and motivations were in 2016 is vital in order to effectively address voter concerns in the future. In the case of this election, voters had strong issue preferences, and they wanted to see positive economic change from what they saw as a frustrating standstill.
In partnership with YouGov, the Voter Study Group polled 8,000 voters in November and December 2016 as part of a comprehensive approach to understanding what voters wanted in this election. The VOTER Survey (Views of the Electorate Research Survey) included questions that ranged from respondents’ attitudes about different demographic groups to their issue priorities — a broad range of elements important in any election. What emerged in this survey is that there are very different prisms of issue priorities through which people view the state of the country and their political decision-making. These issue priority differences are apparent across presidential candidate support and across party affiliation. In this context, Independents were the deciding factor, and in the 2016 political environment they were more in line with Republicans than Democrats. Further, issue priority mixes were actually more enlightening in many ways than demographics in terms of understanding voter groupings and vote choice.
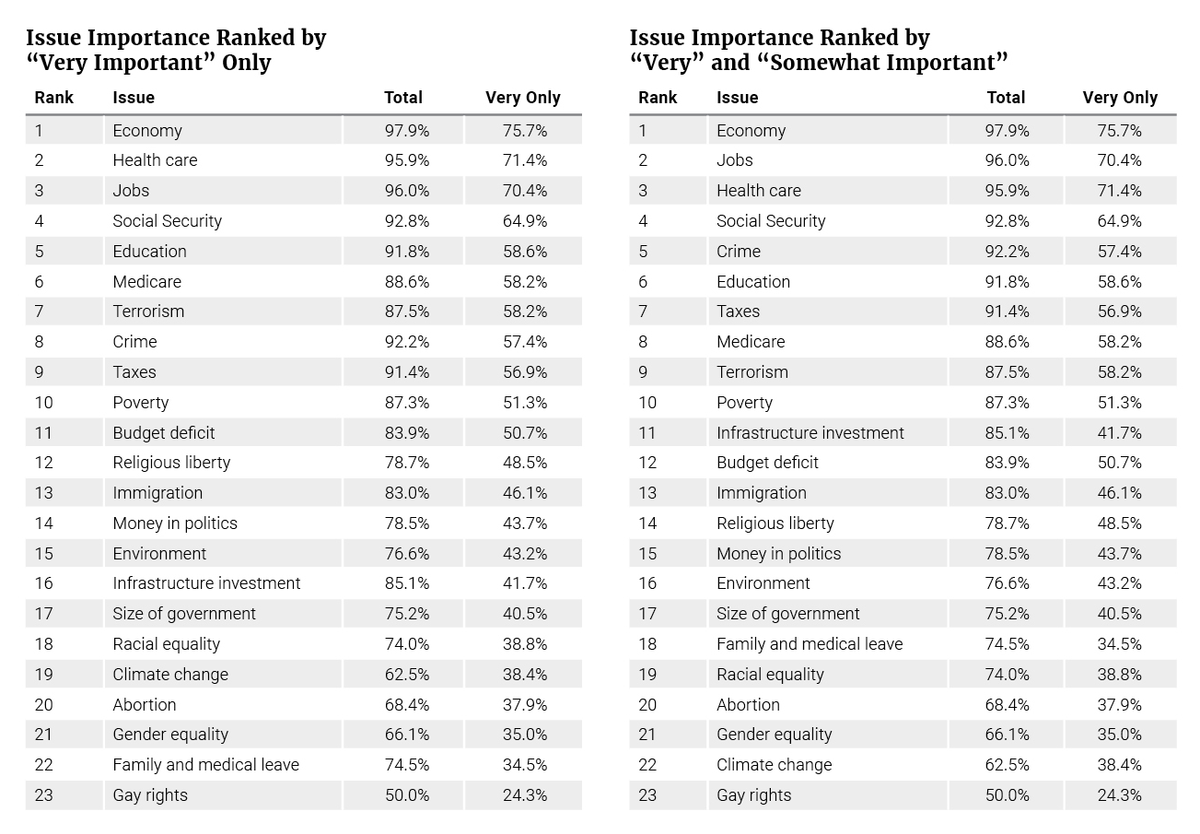
Respondents in the survey were asked how they would prioritize 23 issues and given four choices — was the issue “very important,” “somewhat important," "not very important,” or “unimportant?” The economy remained the issue that was most important to the most voters, with 98 percent of the electorate listing it as important (very/somewhat) (see Tables 1a and 1b). Of the 23 issues tested, seven were identified as important by 90 percent or more of the electorate, and three were identified by 95 percent or more. Those three were the economy, jobs, and health care. The remaining four issues that polled above 90 percent were Social Security, crime, education, and taxes. At the other end of the spectrum, there were four issues under 70 percent: abortion, gender equality, climate change, and gay rights.
More than 70 percent of voters viewed the economy, health care, and jobs as “very important.” When transitioning from the combined “very/somewhat important” to simply “very important,” jobs and health care swapped places in the ranking, but both were clearly in the top tier of issues along with the economy. At the other end of the list, the issues that were seen as “very important” by fewer than 40 percent of the electorate were the same as those on the lower end of the combined “very/somewhat important” list, with the addition of family and medical leave, as well as racial equality.
On average, a respondent listed about 18 issues as “very/somewhat important.” Forty-five percent of the respondents said 20 issues or more were “very/somewhat important.” However, when further prioritizing, the average respondent identified about 11 issues (out of 23) as “very important.” Nearly 8 percent of the respondents said 20 issues or more were “very important.”
The “very important” responses reflect the key issues an individual would consider in deciding how to vote. With an 11-issue average, even the “very important” category probably contains more responses than an individual voter would have put on a personal priority list, but it is reasonable to use for that purpose.
Table 1a and 1b

While there are differences in issue priorities among some demographic groups, what stands out is the general broad agreement on the top-tier issues and to a lesser degree the bottom-tier ones. The most striking differences come when looking at party and ideology, in contrast to demographics such as gender, age, race, income, and education. There is a very important distinction here in that party and ideology are choices as opposed to attributes of an individual such as gender and race. So, if demographics can only get us so far in thinking through what issues went into voters’ decision-making, we can flip the model and look at the electorate defined by issue priorities, rather than demographic variables.
To do that, we ran a k-means cluster analysis of the 23 issues based on the Likert scale nature-of-the-issue questions. We ran the analysis several times with expanded or reduced numbers of categories, within the confines of a reasonable iteration process. There were a number of possible options, and the next step was to run ANOVA tests to define whether any of the options provided clear statistical differences. In this case, the result that produced five groups best achieved this. As in any cluster analysis, more or fewer clusters could be developed. In this case the five here provide a valuable and clear way of understanding some of the major divisions among the electorate in terms of issue priorities. Again, these clusters were created on the basis of issue priorities — how voters ranked the issues (very important, somewhat important, not very important, and unimportant) and then were named according to characteristics we observed about each of these clusters. So, for example, there may be some Republicans in the “Democratic-Leaning” cluster, but they fall into this cluster based on an issue mix that separates them from other Republicans.
Table 2
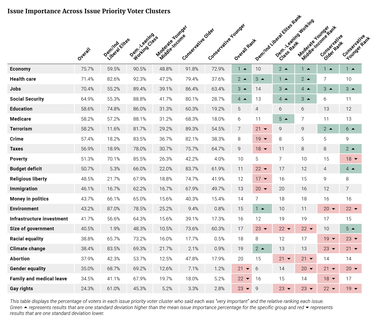
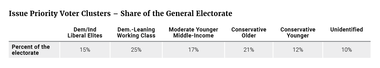
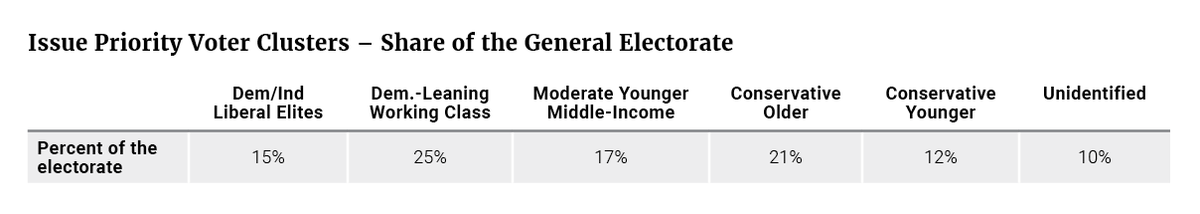
Table 2 displays these five clusters, which we have called the “Democrat/Independent Liberal Elites” (15 percent of the electorate), the “Democratic-Leaning Working Class” (the largest cluster at 25 percent) the “Moderate Younger Middle-Income” voters (17 percent), the “Conservative Older” voters (21 percent), and the “Conservative Younger” voters (12 percent), with an additional 10 percent unidentified by these clusters, but which look overall like an average of the electorate at large. These voters were unidentified because they did not respond to all 23 issue questions.
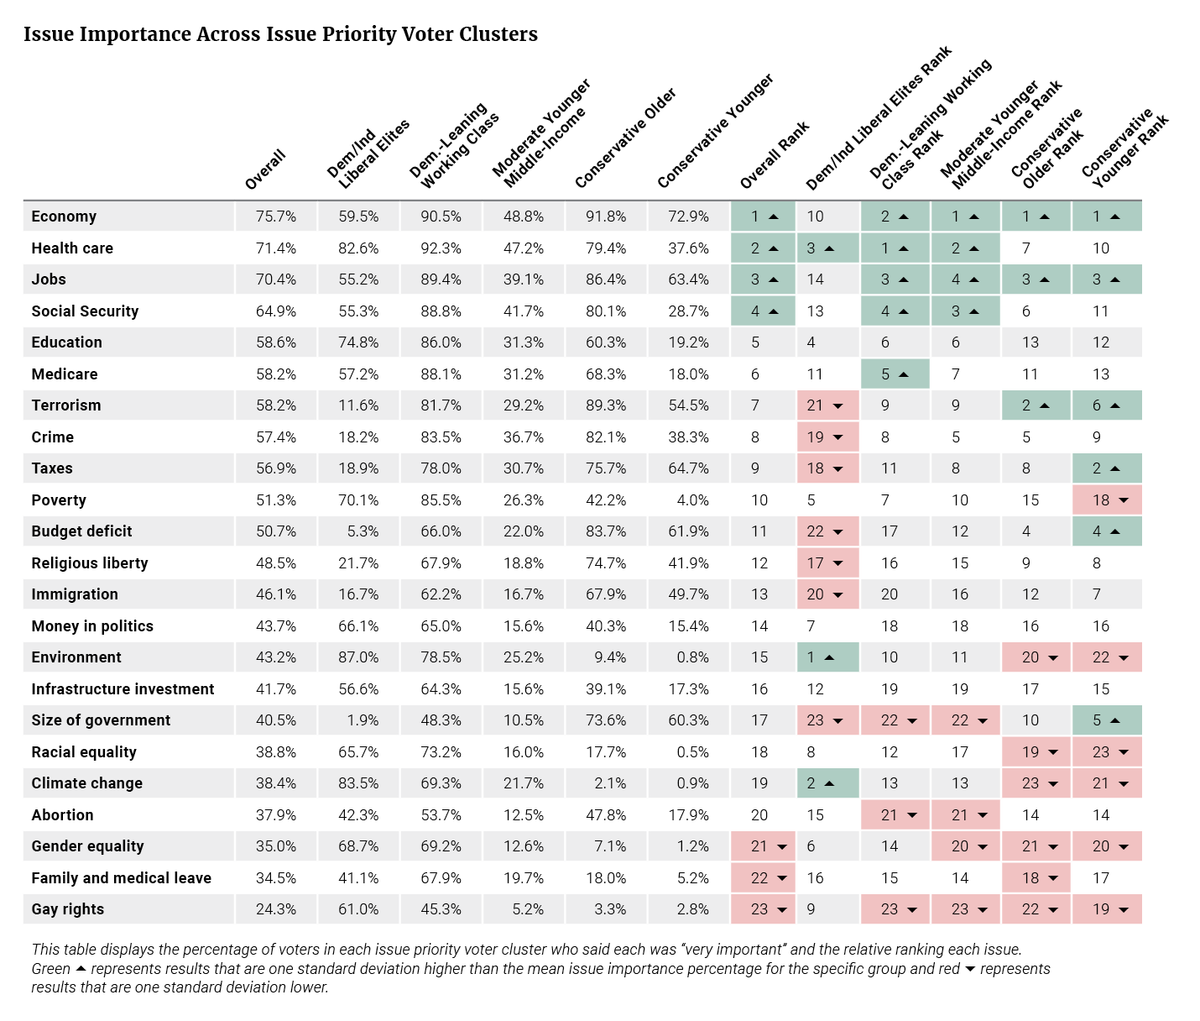
Table 2 shows what percentage of voters in each cluster said an issue was “very important.” The ranking columns are based on that percentage from highest to lowest. The color coding represents significant differences in how each cluster (and the overall electorate) defined the importance of these issues relative to the importance they placed on other issues in order to standardize differences across groups. Green represents issues that were chosen by a percentage of the cluster in question that was one standard deviation higher than the mean for issues for that specific cluster, and red represents results that are one standard deviation lower. For example, in the chart, 87 percent of Democrat/Independent Liberal Elites (DILEs) said the environment was “very important” — a percentage at least one standard deviation above the mean percentage of DILEs saying any of these issues were “very important.” Using this methodology, the issues that are within one deviation of the mean represent about 68 percent of the issues, while those at either end of the spectrum represent about 16 percent for each, giving a reasonable reflection of prioritization. An issue one deviation lower than the mean (in red) does not mean the group thought it was not important, but rather that in contrast to other issues it was less of a priority.
For four of the five clusters, there was some agreement on the most important issues facing the country. The two conservative-leaning clusters and the moderate group all placed the economy at number one, and the left-leaning working class group put it at number two. These four clusters also placed jobs in either third or fourth place. The clear exception was the DILEs who ranked the economy 10th and jobs 14th on their list of issue importance — far outside the priority most of the electorate placed on these issues. The top three slots for DILEs belonged to the environment, climate change, and health care, issues that, with the exception of health care, were rated much lower by all other groups.
The Democrat/Independent
Liberal Elites ranked the economy and jobs far lower in priority than most of the electorate.
DILEs also differed most significantly from the rest of the population in terms of the issues on which they put less emphasis. Their bottom slots belonged to a range of issues including the size of government, budget deficit, terrorism, and immigration. The key differences with the rest of the electorate, including the Democratic-Leaning Working Class (DLWC), were on terrorism (which DILEs ranked 21st, and the rest of the electorate had in the top 10), crime (which DILEs ranked 19th and the rest of the electorate had ninth or higher), and taxes (which DILEs ranked 18th and the rest of the electorate had 11th or higher). In contrast, the conservative clusters put less emphasis on climate change, the environment, gay rights, and gender equality. The DLWC and Moderate Younger Middle-Income (MYMI) clusters put less emphasis on gay rights, the size of government, and abortion.
The significant difference in issue priorities between DILEs and DLWCs is noteworthy. Of the five issue that DLWCs selected as their priorities, DILEs only agreed with one — health care. Of the five issues that DILEs put less emphasis on, DLWCs only agreed on one — the size of government. Otherwise there were significant differences.
Table 3
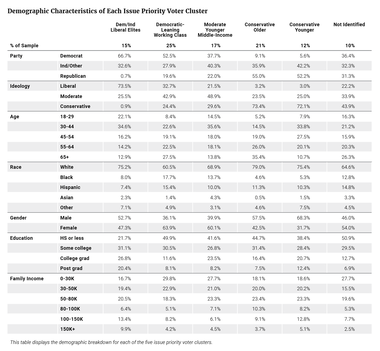
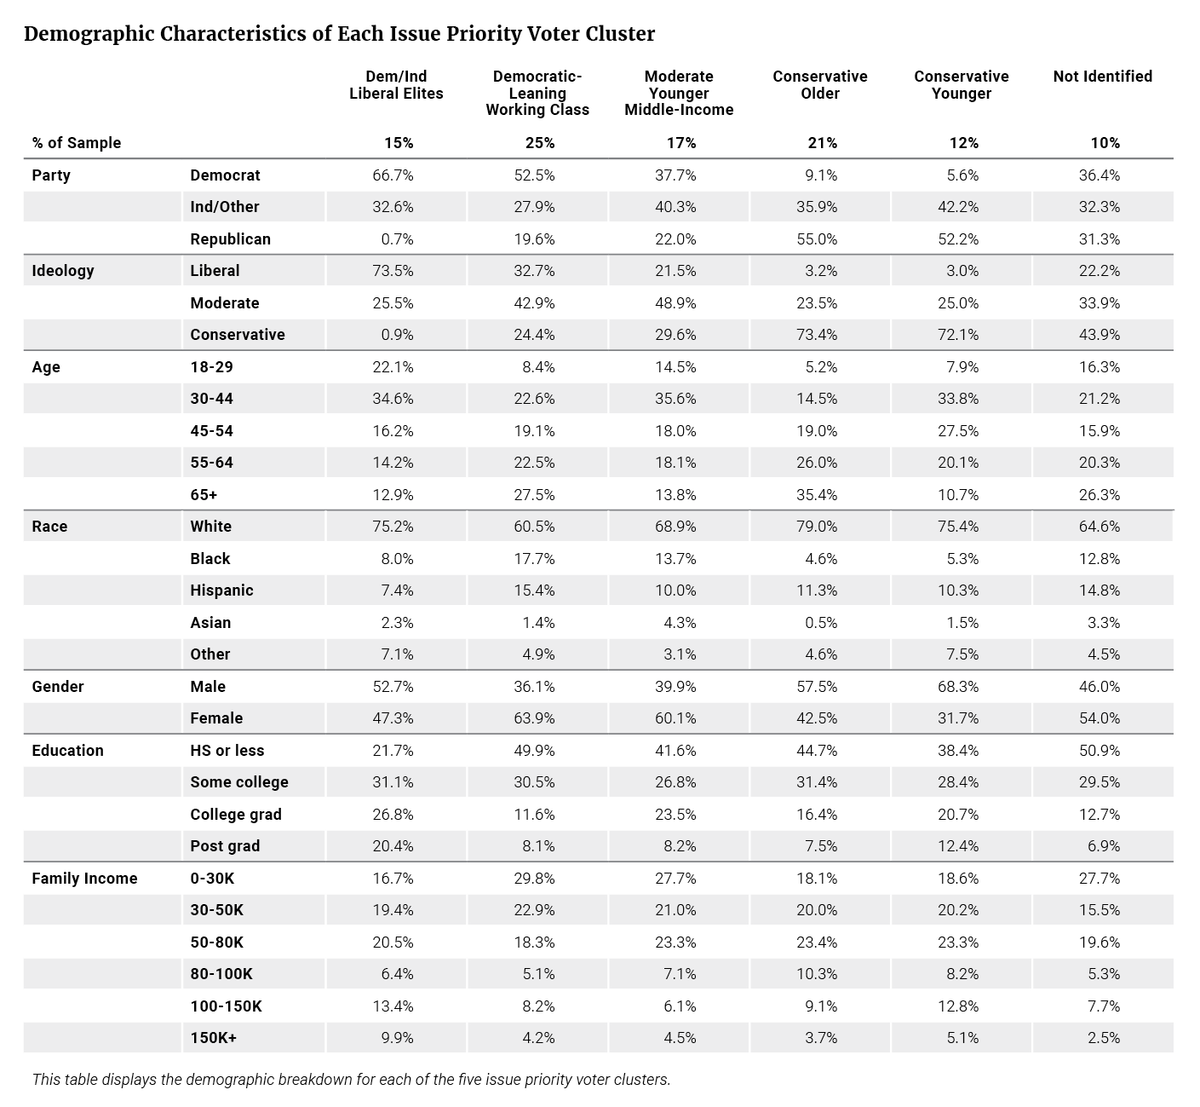
All five of the clusters identified in this sample were clearly distinct from each other on the basis of demographic variables, but the largest differences were within the Democratic coalition (see Table 3). DILEs were almost exclusively Democrats (67 percent) rather than Republicans (1 percent), whereas the DLWCs had a less lopsided 53 to 20 percent partisan split in favor of Democrats. DILEs were also far more left-leaning — 74 percent were liberals and 26 percent moderates compared to DLWCs, 33 percent of whom were liberal, 43 percent moderate and 24 percent conservative. There were also significant divisions with regard to age and education. Fifty-seven percent of DILEs were under the age of 45 and 47 percent held a bachelor’s degree or higher, while 69 percent of DLWCs were older than 45 and only 20 percent had completed college. In terms of income, 53 percent of DLWCs had a family income below $50,000, while 36 percent of DILEs were below $50,000. This income difference is larger than it looks because the DILEs are much younger, and as a consequence less advanced in their careers. Finally, 33 percent of DWLCs were either Hispanic or black, while those two groups made up 15 percent of DILEs. Interestingly DILEs also had the lowest percentage of Hispanics across all the groups (including the unidentified).
The Moderate Younger Middle-Income cluster (MYMIs) more closely reflected the demographic makeup of the wider electorate. They were somewhat younger than average — 50 percent were under the age of 45 — and a 49 percent plurality identified as ideological moderates. MYMIs were also notably more female (60 percent). The two conservative clusters were more demographically homogeneous, with the primary division being age: 61 percent of the Conservative Older (COs) group were over the age of 55, while 69 percent of Conservative Younger (CYs) cluster was under age 55. There were also educational divisions in the GOP coalitions, though not as wide as between the two left-leaning clusters: only 24 percent of COs held a bachelor’s degree or higher, compared to 33 percent of CYs. Both right-leaning clusters were also much more male than the broader population (58 and 68 percent, respectively).
These issue importance clusters help to define clearly the priorities of the electorate, and they are also useful in helping to understand presidential vote choice.
Table 4
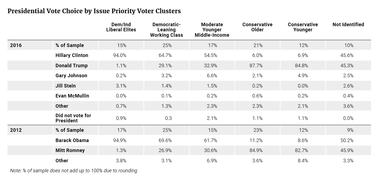
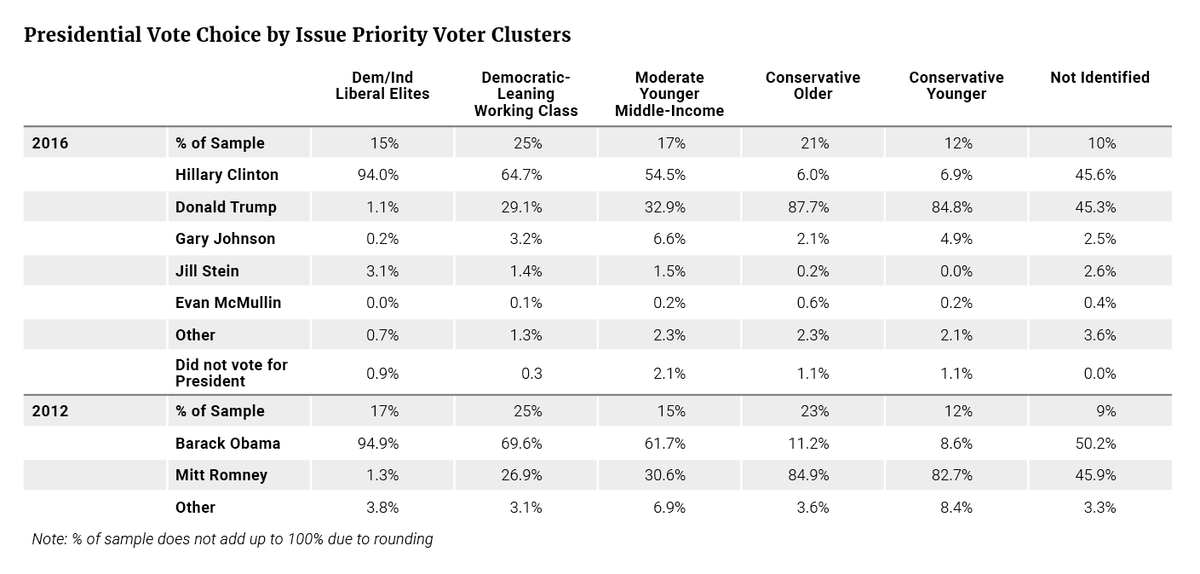
The cluster that an individual was assigned to based on the basis of the issues that they cared about functioned as a good determinant of their eventual presidential vote choice (see Table 4). As the table shows, three of the five clusters, constituting a combined 48 percent of the electorate, voted overwhelmingly for a single candidate. The two right-oriented clusters voted 85 and 88 percent for Donald Trump, and a stunning 94 percent of Democrat/Independent Liberal Elites (DILEs) voted for Hillary Clinton. A majority of the two more divided clusters also supported Clinton, though with nothing approaching the partisan uniformity displayed by the DILEs. The Moderate Younger Middle-Income (MYMI) group split 55 to 33 percent for Clinton, and the Democratic-Leaning Working Class (DLWC) group supported her by a 65 to 29 percent margin. The individuals that did not fall into any of the clusters (the unidentified group) constituted about 10 percent of the electorate, and generally looked like the electorate as a whole. They split their votes, 46 percent for Clinton and 45 percent for Trump.
Looking at how the groups voted in the 2012 election, the mix was about the same. Clinton basically matched Obama among DILEs, and was close to his performance among CYs, but under-performed among the rest of the groups. Trump attracted about the same level of support as Romney did among DILEs and the unidentified, but he improved marginally (between two to three points) among the other groups. In contrasting the two races based on the margin between the Republican and Democratic candidates, the biggest shifts occurred among MYMI (+10R), CO (+8R) and DLWC (+7R). Those shifts were created more by a loss of votes for Clinton than an increase in the vote for Trump.
Table 5
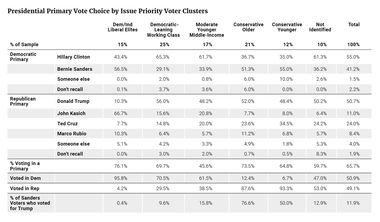
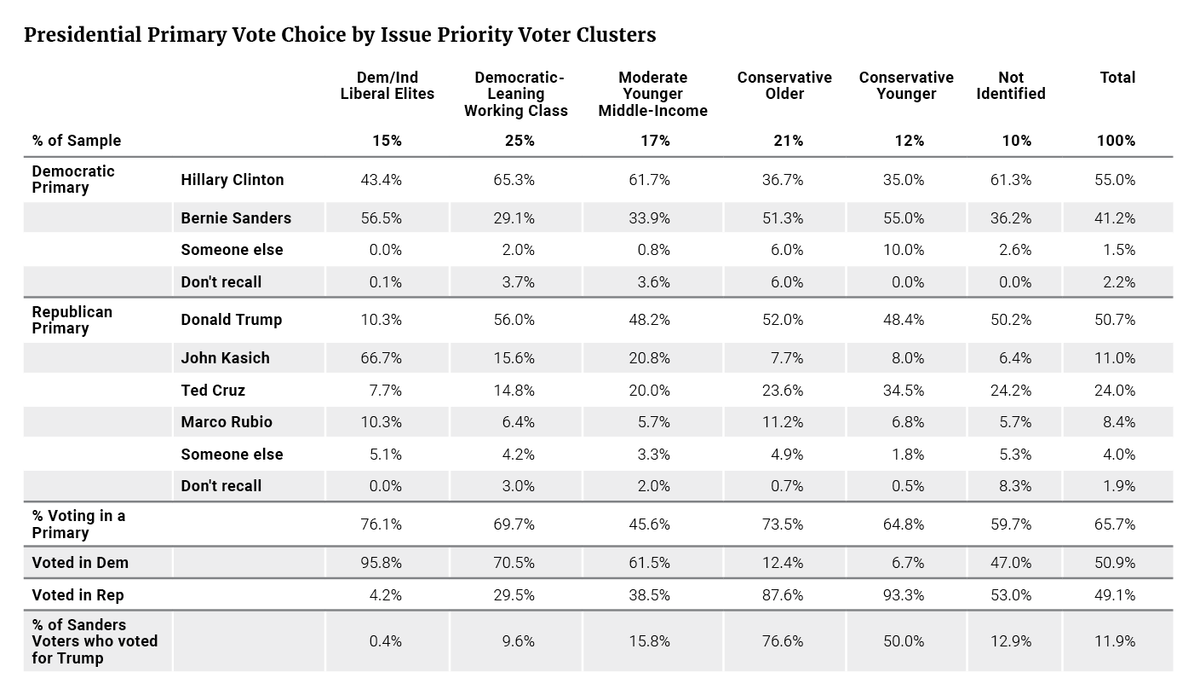
One question that emerges is how much of the change from the Obama vote to the Clinton vote came from defecting Sanders voters. Among the DLWCs about 10 percent of the Sanders primary voters cast their ballot for Trump. This represented about a 2 percent overall loss within the cluster, and represented about 33 percent of the difference between Clinton and Obama within this cluster. Since this group represented a quarter of the electorate, this was significant. Among MYMIs, about 16 percent of the Sanders primary voters cast their ballot for Trump, also resulting in about a 2 percent overall loss in this cluster. This represented 28 percent of the difference between Clinton and Obama. While this cluster was not as large as the DLWC cluster, it was the group where Clinton most underperformed in contrast to the Obama vote.
What is remarkable about the DILEs is that Clinton lost them by a significant margin during the primary (see Table 5). Seventy-six percent of them voted in the primaries; of those, 96 percent voted in a Democratic primary. Among those voters, Sanders beat Clinton by a 57 to 43 percent margin, yet she came back to win 94 percent of this group in the general election, as she also won 94 percent of those who had voted for Sanders (with the bulk of the remaining vote going to Stein — 4 percent). The DLWCs are a very different story. About 70 percent voted in the primaries, with 71 percent voting in a Democratic primary, and among those, Clinton won by the large margin of 65 to 29 percent, not surprising given that this is where a significant amount of the minority vote resided.
While these issue clusters defined distinct viewpoints, how did the issue mix of a Clinton voter differ from that of a Trump voter?
Table 6
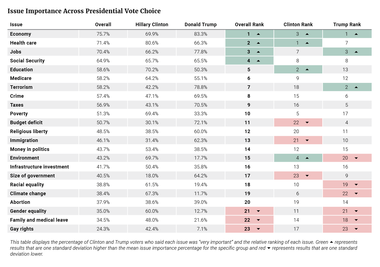
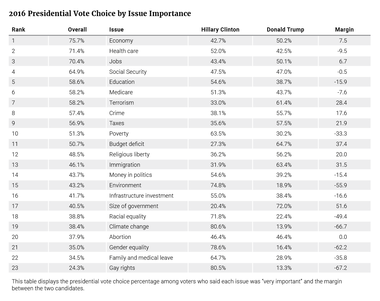
The overall electorate ranked the economy, health care, jobs, and Social Security as their top key issues (see Table 6). Clinton voters agreed that the economy and health care were of greater importance, but added education and the environment to that list. Meanwhile, Trump voters focused on the economy, jobs, and terrorism as their key priorities. Clinton supporters placed less emphasis on the budget deficit, immigration, and size of government, which were issues in the top 10 for Trump supporters. Similarly, Trump voters put less emphasis on the environment, climate change, or racial equality, which were in the top 10 for Clinton voters. Here, we see Clinton voters setting a high priority on an issue mix more closely aligned with the DILEs from the issue cluster analysis.
This presented an important issue difference in contrast to other key clusters for her. For both the DLWCs and the MYMIs, Clinton had to perform well. In both cases she fell short of Obama’s 2012 performance, by 5 points among DLWCs and 7 points among MYMIs.
In looking at the issues concerns of those two groups there were significant similarities. The top four issues (economy, health care, jobs, Social Security) were the same (although the ranking was slightly different), and they matched the electorate overall. DLWCs added one more issue to the higher priority list: Medicare. Looking at those issues that there was less emphasis on, again there was agreement on size of government, gay rights, and abortion. MYMIs also placed less emphasis on gender equality. However, these two clusters had significantly different issue priorities than DILEs — and that was a challenge for Clinton.
Trump did marginally better than Romney among his base groups — CO (3 points) and CY (2) — and among MYMI (2) and DLWC (2). The key here was that all four of these groups had the economy and jobs as part of the higher priority issues.
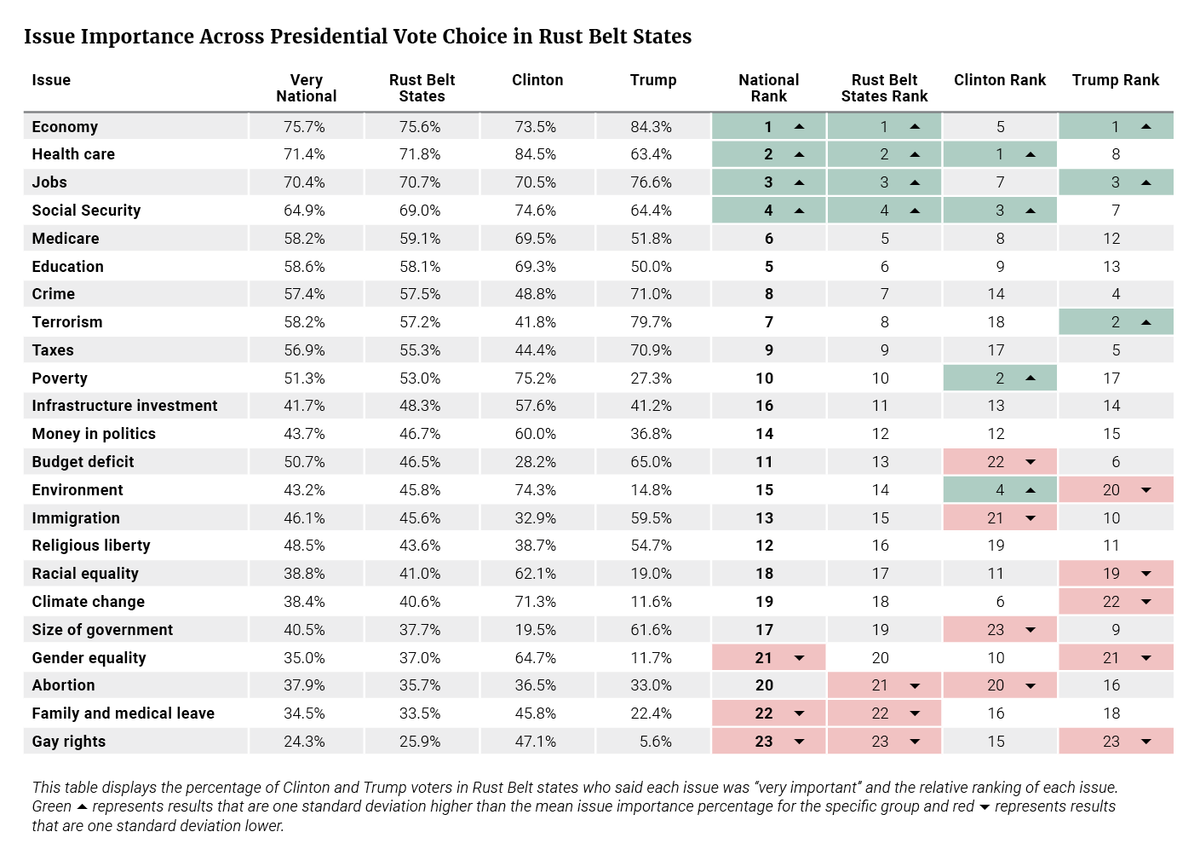
The Rust Belt was a key to the election, as described earlier. A Republican candidate had not carried Pennsylvania, Ohio, Michigan, and Wisconsin in 32 years, despite three Republican wins, although Trump’s margins in Pennsylvania, Michigan, and Ohio were less than 1 percent. These states were an area of particular interest due to the white union working class population, and there is likely a good bit of overlap between Rust Belt voters and the DLWCs. Between their top 10 issues, there was only one swap, as DLWCs placed more emphasis on the environment and Rust Belt voters placed more emphasis on taxes (see Table 7).
Table 7

Overall, in the Rust Belt states, we can see that the issues priorities largely matched the electorate as a whole, and the higher issue priorities of economy, health care, jobs, and Social Security were the same and in the same order. The key here is the economy. Trump voters had this as their top issue and a higher priority, while Clinton voters had it as their fifth issue and as an average priority.
Clinton actually won more issues and many by greater margins. However, when looking at the overall importance of these issues to the overall electorate, Trump won two of the top three issues, including the most important, the economy.
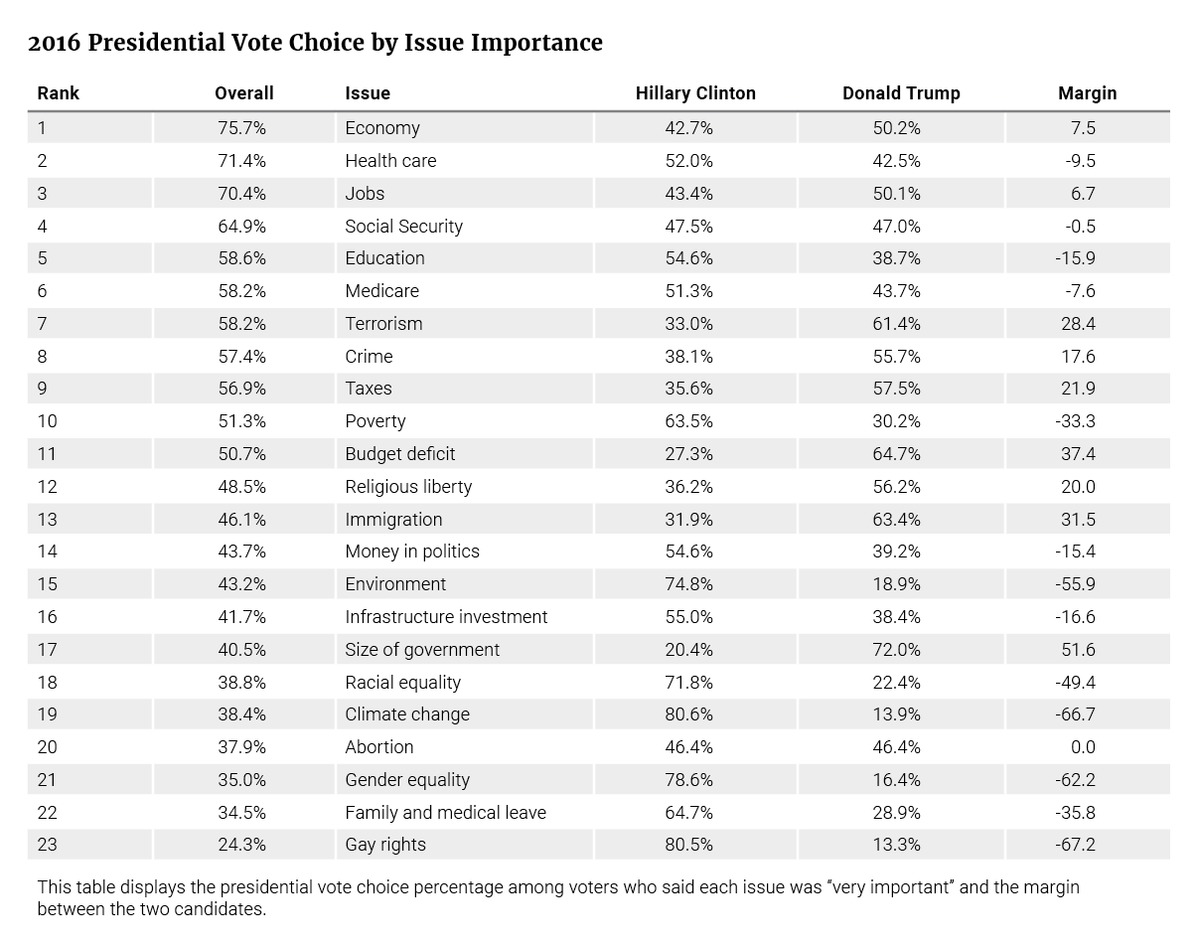
So, at a national level, what were the margins between the two candidates in terms of issues? In considering the voters who categorized a given issue as “very important,” what percentage of them subsequently voted for either candidate? For the purpose of concision in this brief discussion, a candidate who won the general election vote of a majority of voters who found an issue “very important” will be described as having “won that issue.” To be clear, the survey did not ask which candidate a voter trusted on that issue.
Table 8
Trump’s largest margins were among voters who prioritized size of government (where he won by a margin of 52 points among voters who thought this issue was “very important”), the budget deficit (37 point margin), immigration (32), and terrorism (28) (see Table 8).
Clinton’s greatest margins were among voters who prioritized gay rights (67), climate change (67), gender equality (62), and the environment (56).
Clinton won more issues, but the ones Trump won mattered significantly more.
Clinton actually won more issues and many by greater margins. However, when looking at the overall importance of these issues to the overall electorate, Trump won two of the top three issues, including the most important, the economy.
While Clinton fared better on more issues, those on which she was strongest included only one in the top 10 — poverty. Of the seven on which she performed best, five were at the bottom of the country’s list. There were a few key top 10 issues that leaned Clinton — health care being the most important, followed by education and Medicare. Notably, the issues on which she won very strongly are more similar to the issue priorities of the DILE cluster, rather than the DLWCs.
Neither candidate had an advantage among voters who prioritized the issues of abortion or Social Security.
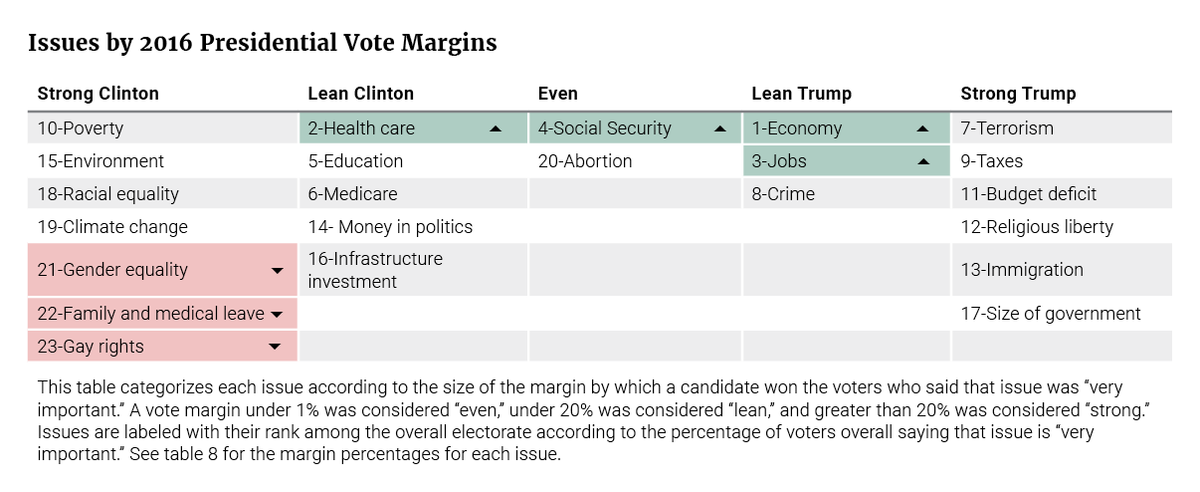
Table 9
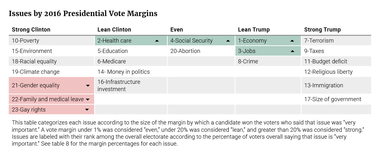
Trump won fewer issues, but the “lean Trump” (where Trump had a small margin among voters who prioritized those issues) were all top 10 issues, including the central issues of the economy and jobs, with crime also on that list (see Table 9). This bolstered the strong Trump issues (where he had a larger margin) which included two in the top 10 — terrorism and taxes, as well as some middle of the road issues that were more important to the electorate than the strong Clinton issues. So overall, Clinton did better on 12 issues and Trump did better on nine. However the mean ranking of the issues Clinton did better on was 14, while for Trump it was nine. So Clinton won more issues, but the ones Trump won mattered significantly more.
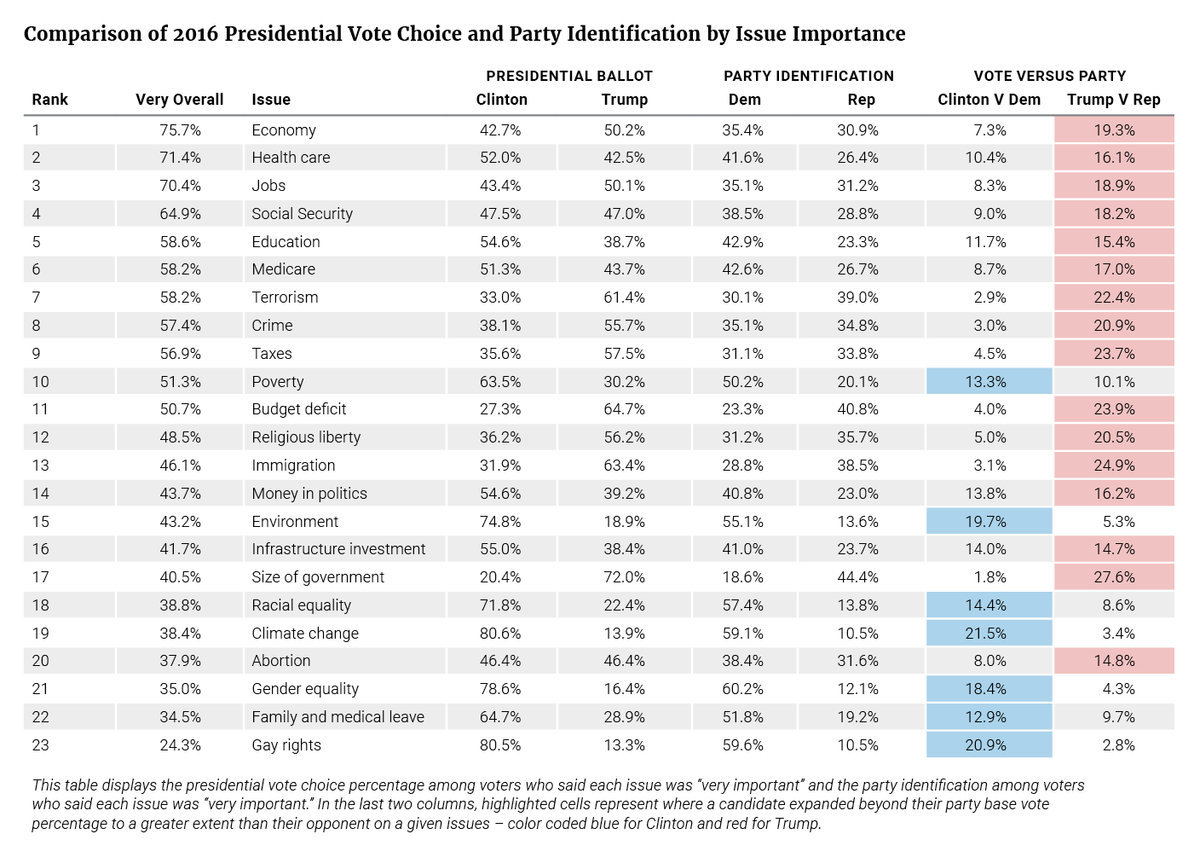
Taking this a step farther, we need to examine how each candidate did in gaining support beyond their respective party. The next table looks at each issue and compares the party percentage on each with the candidate percentage, and who did better (see Table 10). In looking at the economy, of those who said the issue was “very important,” 35 percent were Democrats. Again, of those who said the economy was a “very important” issue, 43 percent voted for Clinton. So Clinton outperformed her party base by 7 points. Trump outperformed his party base by 19 points (31 percent were Republican, 50 percent voted for Trump).
Table 10

Of the 23 issues, Clinton was able to go farther beyond her party support than Trump was able to go beyond his on seven issues. However, of those issues only one was in the top 10 — poverty. Five of them were in the bottom eight issues. There were four issues where she was able to outperform her party support by 15 points or more — climate change, gay rights, the environment, and gender equality, none of which were in the top 10. In contrast, Trump was able to do better by more than 15 points on 14 issues, including 13 of the country’s top 14. Clinton’s lack of reach beyond her party was evident.
There is a caveat here, as the party identification in the survey favored the Democrats, 36 to 30 percent (the national exit poll of the five networks and the AP had it at 36 to 33 percent), so Clinton had less distance to go to get to a majority coalition. However, neither candidate was able to achieve a majority coalition in the popular vote.
The economy was the top issue in this election. The VOTER survey reflected this as two of the three issues that more than 70 percent of the electorate said were “very important” — the economy (76 percent) and jobs (70 percent). So it is not surprising that the electorate’s view of the economy heading into the 2016 general election was negative.
Overall, almost two-thirds of all voters believed that the country was on the wrong track (23 to 62 percent) (see Table 11).
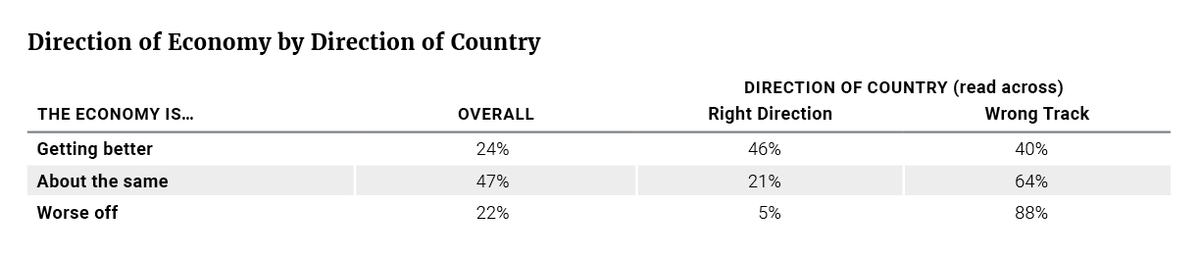
Table 11
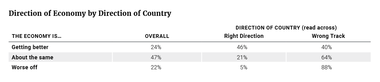
When voters were specifically asked how the economy was doing, 24 percent thought it was getting better, while 22 percent thought it was getting worse. But among the 47 percent who thought the economy was about the same, 64 percent thought the country was on the wrong track.
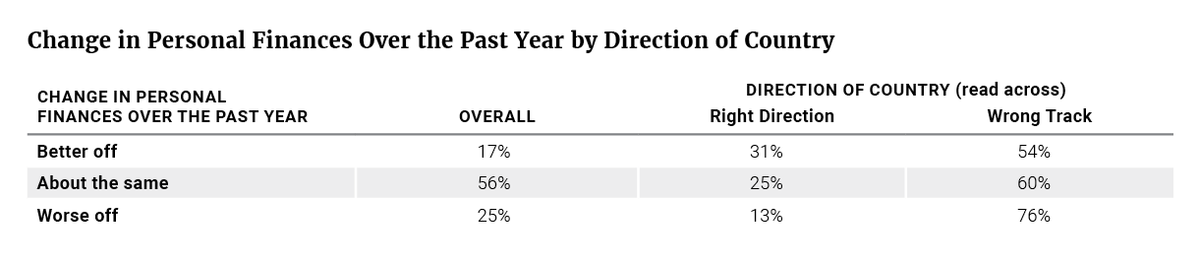
Table 12
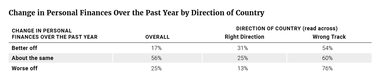
In looking at how the electorate viewed their own personal finances (see Table 12), only 17 percent thought they had gotten better over the past year, while 25 percent thought they were worse off. Again there was a large group, in this case a majority, 56 percent, who thought things were about the same, and again they had a very negative attitude about the direction of the country, with 60 percent believing the country was on the wrong track. Additionally, even among those that thought their own personal finances were better, 54 percent thought the country was on the wrong track, and less than a third (31 percent) thought the country was headed in the right direction.
The “about the same” response of the plurality of voters on both these economic questions did not indicate people were content with the state of the country as their neutral responses might suggest. In this particular election cycle, the sense of stagnation — whether with regard to personal circumstances or the economic health of the country overall — should be read as a fairly strong negative reaction and a sign of frustration. When even those voters who feel personally better off are pessimistic about the country’s direction, it becomes extremely difficult to defend the status quo.
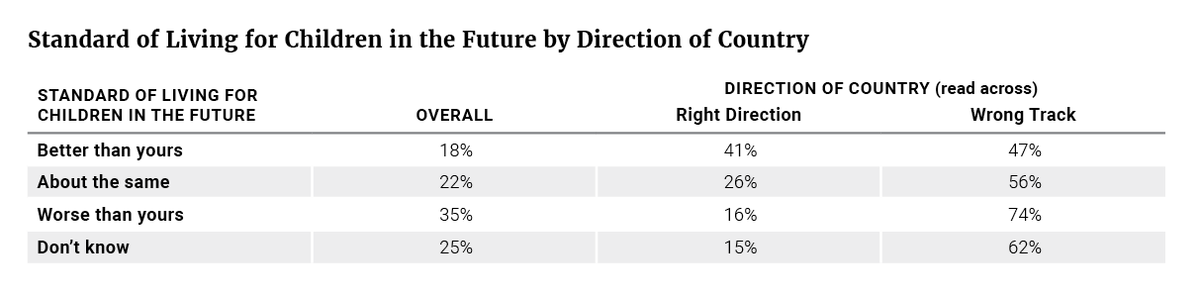
This frustration was further seen when the electorate was asked about the standard of living for children in the future, as only 18 percent thought it would be better, and even among these voters, more thought that the country was on the wrong track (47 percent) rather than headed in the right direction (41 percent) (see Table 13).
Table 13

As might be expected, 74 percent of voters who believed that their children would be worse off than they are also believed that the country is on the wrong track. But a substantial segment of the electorate (25 percent) responded that they did not know whether or not their children would be better off, and among that population 62 percent believe the country is on the wrong track.
Among the respondents who thought their children would be better off, and also that the country was on the wrong track, 51 percent voted for Trump and 39 percent voted for Clinton. In this case, a belief that the country was on the wrong track — a group which Trump won overall by 50 to 41 percent — outweighed a belief that your children would be better off — a group which Clinton won by 49 to 45 percent — in defining these voters’ ultimate choice. The sense is that these voters believed that things had to change dramatically in order to make that better future for their children possible.
The national exit poll asked the electorate about what quality mattered most in deciding for whom to vote for president. The top response was “can bring needed change” at 39 percent. Among those voters, Trump beat Clinton by a staggering 82 to 14 margin. This construct of change versus status quo was a critical dynamic in defining this election.
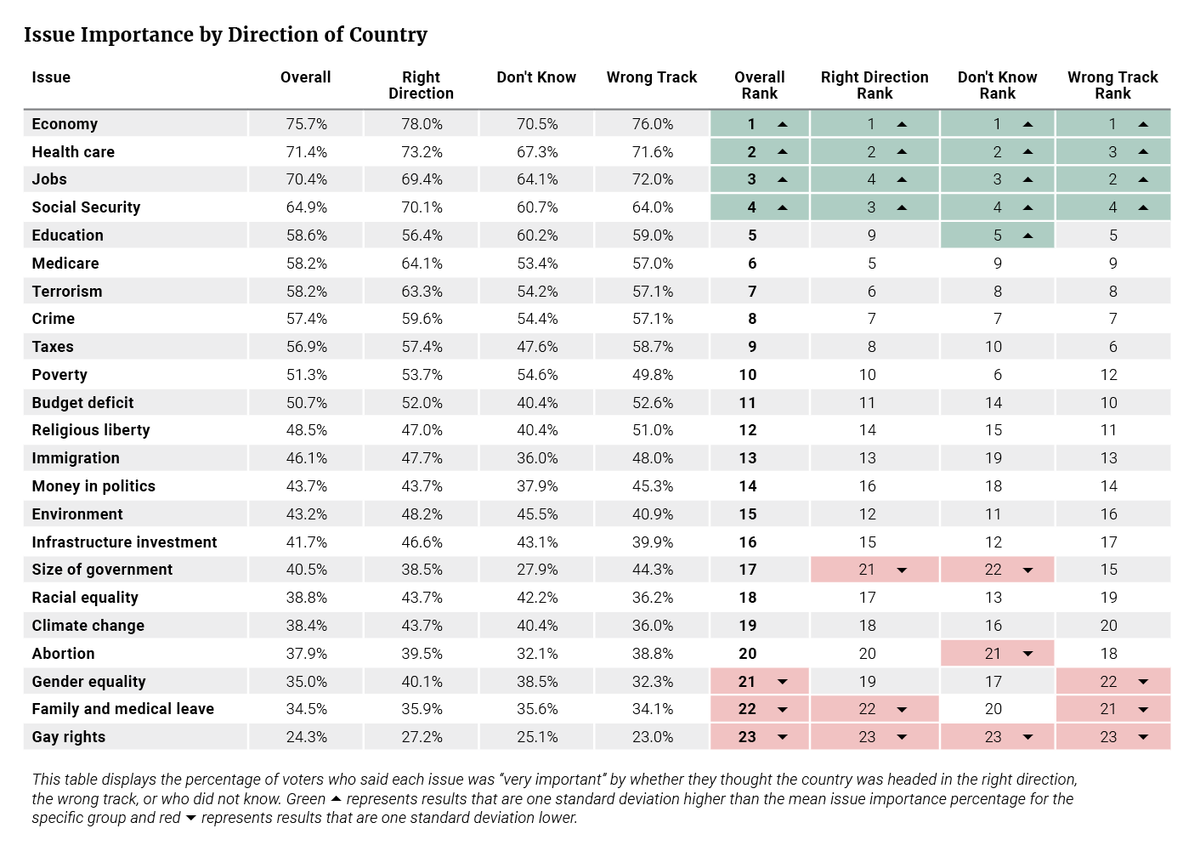
No matter their view on the direction of the country, there was general agreement among voters on what issues that needed attention, with the economy leading the way, and the rest of the list including health care, jobs, and Social Security. The only difference was among those who were unsure about the direction of the country. That group added education to their list. There was less unanimity at the lower end of the spectrum, with both groups placing gay rights and family/medical leave in the “least important” spots. However, there was substantial disagreement on the issue of the size of government, with those who thought we were moving in the right direction considering it significantly less important (21st) than those who thought we were on the wrong track (15th) (see Table 14).
Table 14
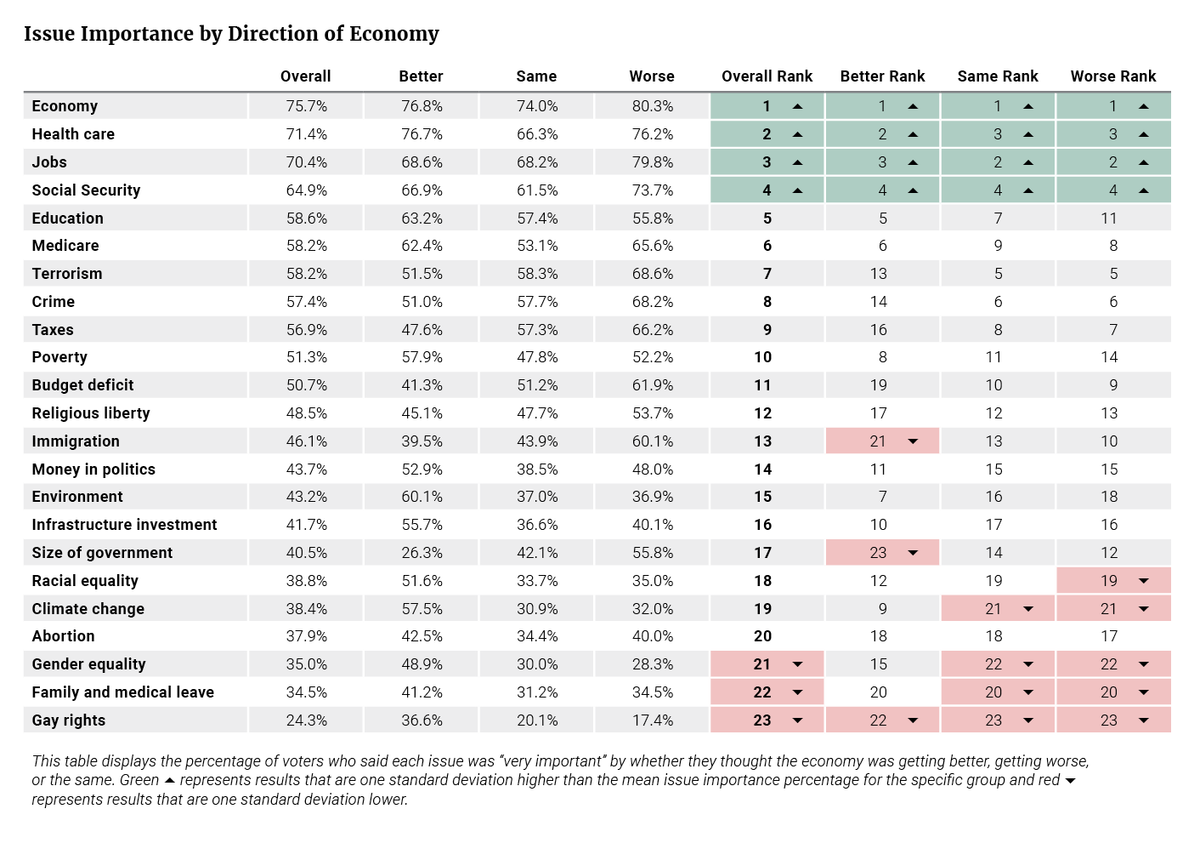
When looking at issue rankings through the lens of how a voter thought the economy was going, there was little difference in terms of issue emphasis. Again, the economy led the way, with health care, jobs, and Social Security on the list. There was more divergence on which issues were the least important. Those who thought the economy was doing better were more likely to elevate the importance of gender equality and climate change, while they placed moderately ranked issues such as immigration and size of government at the bottom of their list of issue concerns. Perhaps most significant, the issue priorities of those who thought the economy was doing worse and those who felt that conditions were unchanged were a very close match. This provides additional support for the idea that the “about the same” response is not a neutral response when applied to economic conditions, but rather an opinion with a more negative connotation (see Table 15).
Table 15

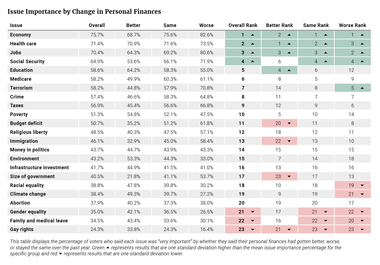
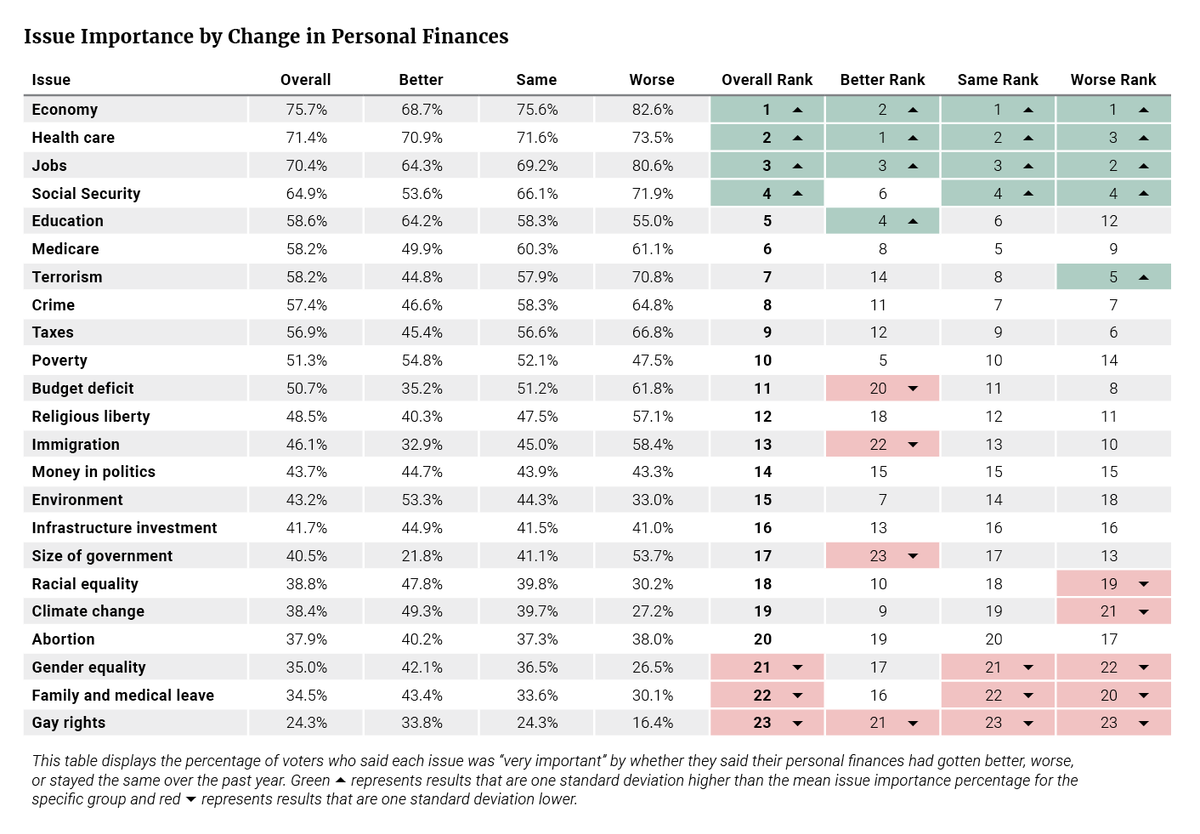
Finally, when looking at this through the prism of how people viewed their personal (family) finances over the last year, the issues they emphasized more were similar. In this case, the economy was not the top issue across the board, as those who thought their personal finances had improved ranked the economy as the second issue. Nonetheless, they generally agreed with the rest on the importance of jobs, health care, and Social Security. There were two differences. First, those who thought things had improved swapped out Social Security and put education in its place, which was not surprising as 57 percent of the group was 44 years old or younger. The other change was among those who thought their personal finances had gotten worse. They added the issue of terrorism. Once again, the most optimistic voters were more likely to have differing issue priorities further down the list. The “better off” group placed the budget deficit, immigration, and the size of government at the bottom of their list of priorities — issues where their chosen placement differed from that of the “worse off” group were by 12, 12, and 10 spots, respectively. The financially “the same” and “worse off” groups placed less emphasis on gender equality, family and medical leave, and gay rights, matching the overall view of the electorate. Those who said they were worse off also placed less emphasis on racial equality and climate change (see Table 16).
Table 16
The electorate in 2016 was broadly dissatisfied with the state of the economy, even though that dissatisfaction was masked by the substantial numbers of voters who reported that their personal economic conditions had not changed. But voters are not content with the status quo. They want to see their wages rise and greater opportunities for themselves and their children. When the status quo feels unsustainable, even an unconventional candidate who promises to “shake things up” can feel like a less risky choice than “staying the course.”
As a result, it is clear that the economy and economic concerns were central to this election.
What emerges from the VOTER Survey is that there are very different sets of priorities that impact the prism through which people view goals for the country. When the electorate is grouped by their issue priorities, we can start to see some points of disconnect and which issue sets united voter groups. This analysis reflects the idea that a person has a set of views that, for example, define their party preference as opposed to belonging to a party that then defines their set of views.
This research shows that voters do care about issues and that issues can be used to cluster voters into meaningful segments with clear priorities and belief systems that translate into party preference, ideological choice, and voting decisions. This is particularly true for the DILEs, 94 percent of whom voted for Clinton.
Though an unconventional candidate, Trump ended up winning more voters who prioritized the top 10 issues, including the economy, jobs, crime, and terrorism, while Clinton won many of the lower tier issues such as climate change. In this election, the contrast of change versus status quo moved swing voters closer to Republicans, based on issue priorities centered around economic issues, and this was particularly true in the Rust Belt, where the election was decided.
Issues mattered to the electorate, and they mattered in vote choice.
Our research suggests an interesting challenge going forward. Democrats have a clear issue priority split between Democrat/Independent Liberal Elites and the Democrat-Leaning Working Class — specifically over the prioritization of the economy and jobs. This difference extends to the swing cluster of Moderate Younger Middle-Income. In contrast, the two Republican base clusters of Conservative Younger and Conservative Older prioritized the economy and jobs and now Republicans have an opportunity to build further into MYMI and DLWC. The question is, will Republicans build on their opportunity first, or will Democrats work through their economic dissonance first? How these questions are answered will be critical in defining where the electorate places governing responsibility in the future.
This section provides additional analysis of the differences in cluster demographics, as well as responses to select questions on immigration and economic issues. Note: Percentages for a question may not add up to 100 percent exactly due to rounding.
Table A-1
This group constitutes one of the most distinct clusters in that it differs significantly from the general population. DILEs are overwhelmingly Democratic (67 percent) rather than Republican (1 percent); and of those that voted in a primary, 96 percent participated in the Democratic presidential primary in their state, while only 4 percent participated in the Republican primary. Of those who voted in the Democratic primary, 57 percent supported Sanders and 43 percent supported Clinton, an inversion of the overall Democratic primary vote among the total sample, where Clinton prevailed 55 to 41 percent.
Seventy-four percent of DILEs are liberal, 26 percent moderate, and a mere 1 percent conservative. They are weighted heavily towards the younger end of the age spectrum, with 57 percent of DILEs under the age of 45. Perhaps most surprisingly for such a Democratic cohort, DILEs are whiter (75 percent) than the overall population (70 percent) and Democrats overall (57 percent). They are also more highly educated than the average voter, with 47 percent holding at least a bachelor’s degree (28 percent of the total population has a bachelor’s degree or higher, and 27 percent of all Democrats do). They also had higher incomes as well, with 24 percent making $100,000 or more, in contrast to 14 percent of the total population with this level of family income.
In looking at how DILEs prioritize issues, they place more emphasis on issues such as the environment, climate change, and health care and place less emphasis on the importance of the size of government, the budget deficit, terrorism, immigration, crime, taxes, and religious liberty. Perhaps more notable are the issues that do not appear among their top concerns. The economy is either the first or second issue for every other cluster; it is 10th for DILEs. Similarly, jobs is a top four issue for every other cluster; for DILEs, it is 14th. DILEs are also much more likely than other clusters to elevate gender equality (it ranked 21st nationally, sixth by DILEs), and gay rights (it ranked 23rd nationally, ninth by DILEs) on their list of concerns.
On economic issues DILEs are conventionally liberal. Ninety-three percent believe that taxes should be raised on the wealthy and 59 percent believe that there is too little regulation of business by the government (they are the only group in which a majority of respondents favor that position). Perhaps unsurprisingly, 82 percent of DILEs also believe that we need a strong government to handle economic problems. Their liberalism extends to questions surrounding immigration. While only 36 percent of all respondents believe that illegal immigrants make a contribution to American society, 84 percent of DILEs agree with that position. Following from that belief, 89 percent of DILEs believe in establishing a pathway to citizenship for immigrants who are here illegally. A nearly unanimous 94 percent of them oppose a temporary ban on Muslim immigration to the United States. No other cluster comes close to matching DILE uniformity on these immigration issues.
DILEs constitute 15 percent of the total electorate. A remarkable 94 percent of them supported Hillary Clinton in the 2016 presidential election, and only 1 percent voted for Donald Trump.
This cohort of voters is closer to the median voter than DILEs, though they still lean left. Fifty-two percent of DLWCs are Democrats, 28 percent are Independents, and 20 percent are Republicans. This group is a more moderate breed: only a third of them identify as liberal, 43 percent as moderate, and 24 percent as conservative. These are the Democratic voters who delivered the 2016 primary for Hillary Clinton. Seventy percent voted in a primary, with 71 percent casting ballots in the Democratic primary and 30 percent in the Republican one. Among those who voted in the Democratic primary, 65 percent supported Clinton and 29 percent supported Sanders (among the 21 percent of DLWCs who participated in the Republican primary, Trump prevailed with 56 percent). DLWCs are a significantly older group than DILEs, with 69 percent over the age of 45. They are also more diverse; 33 percent are either black or Hispanic, compared to only 15 percent of DILEs. They have lower levels of educational attainment, with 80 percent having some college or less, and lower levels of income with 52 percent making less than $50,000. The most lopsided stat for this cluster is gender: 64 percent of DLWCs are female.
DLWCs place more emphasis on health care, the economy, jobs, Social Security, and Medicare. These priorities align them with the top issues of every other cluster except the DILEs, although DLWCs place Medicare as a higher priority than any other cluster (fifth place). The issues that they place less emphasis on are gay rights, the size of government, and abortion. Their highest priorities paint a clear picture of this significant portion of the electorate: they are interested in bread-and-butter issues that have a direct effect on their economic opportunities or quality of life. As a cluster that is both older and poorer than average, it is no surprise that potential sources of greater economic security — whether job growth or government assistance — are the issues that they care about most.
On economic issues, it becomes easier to see why DLWCs are ordinarily an important part of the Democratic coalition. Seventy-eight percent of DLWCs favor an increase in taxes on the wealthy, and 47 percent favor a strong government as opposed to 33 percent who favor a free market. Fifty-three favor an increase in trade (only 15 percent oppose it and a large number of DLWCs have no opinion on the issue), while there is almost even division on the question of business regulation. Twenty-three percent of DLWCs believe that businesses are too heavily regulated, 29 percent believe there is too little regulation, and 32 percent believe that the current level of regulation is about right. DLWCs are more closely divided on the question of the impact of illegal immigrants on American society: 44 percent believe they are mostly a contribution, while 35 percent think they are mostly a drain. Despite this ambivalence, 62 percent of DLWCs still favor a pathway to citizenship for illegal immigrants. This does not mean, however, that they are opposed to further immigration restriction: 45 percent believe that it should be harder for foreigners to immigrate to America than it currently is, and only 21 percent believe that it should be easier. Thirty-two percent favor a ban on Muslim immigration and 53 percent oppose. There are significant divisions between DILEs and DLWCs on these questions.
DLWCs constitute a full 25 percent of the total electorate, making them numerically the largest of the five clusters identified in this analysis. Sixty-five percent of DLWCs voted for Hillary Clinton in the 2016 presidential election, while 29 percent supported Donald Trump.
This cluster is the group of median voters that has the least attachment to either of the two major parties and that holds a mix of moderate political views. Thirty-eight percent of MYMIs are Democrats and 22 percent are Republicans; the largest affiliation is Independent at 40 percent. They are more likely to be moderates (49 percent) than liberal (22 percent) or conservative (30 percent). Fifty-four percent of this cohort did not participate in either party’s 2016 presidential primary. Among those who did, 62 percent voted in the Democratic primary and 39 percent in the Republican. MYMIs tilt younger, as their name suggests — 50 percent are younger than 45 — and female (60 percent). Both their racial and educational breakdowns come closest to matching those of the wider electorate: 68 percent of MYMIs have completed something less than a bachelor’s degree, 69 percent are white, and 24 percent are either black or Hispanic.
Unsurprisingly, the ordering of MYMI issue priorities is a close match for the ordering of the overall electorate. MYMIs place more emphasis on the economy, health care, Social Security, and jobs, and place less emphasis on gay rights, the size of government, abortion, and gender equality. They bear the closest resemblance to the DLWCs with their emphasis on “kitchen table issues” and less emphasis on more social/ideologically-charged debates. These are also the two clusters that did not vote overwhelmingly (more than two-thirds) for one candidate or the other, but were more divided.
The MYMI views on major economic questions are mixed. Forty-eight percent favor an increase in trade, and 20 percent do not (32 percent are unsure). Thirty-six percent believe a strong government is important, while 38 percent prefer the free market (26 percent of MYMIs ar unsure of their preference). There is also an even breakdown on the question of business regulation: 24 percent of MYMIs say there is too much, 22 percent say too little, and 30 percent say just the right amount. The only economic question where MYMIs state a strong preference for a single position is on the question of tax increases on the wealthy; 74 percent favor the idea. MYMIs are also more divided than other clusters on immigration and economic policy issues. Thirty-one percent of MYMIs believe that illegal immigrants make a contribution, and 33 percent believe that they are mostly a drain. Forty-three percent favor a pathway to citizenship, and 31 percent oppose it. There is more agreement on potential changes to immigration law — 41 percent believe that immigration to America should be harder and only 18 percent easier. There is even a close split on a potential ban on Muslim immigration: 38 percent of MYMIs favor one, and 42 percent oppose.
MYMIs constitute 17 percent of the total electorate. Fifty-five percent of MYMIs voted for Hillary Clinton in the 2016 presidential election and a third supported Donald Trump. In the respective primaries, Clinton beat Sanders 62 to 34 percent, and Trump led the field with 48 percent. However, Clinton won the Sanders supporters by the narrower margin of 59 to 18 percent.
This group, as the name suggests, is both more Republican and older than the average voter. Fifty-five percent of COs identify as Republicans, 36 percent as Independents, and only 9 percent as Democrats. Seventy-three percent are conservative, 24 percent are moderate, and a mere 3 percent are liberal. A full 80 percent of COs are over the age of 45, and 79 percent are white. Seventy-four percent participated in a primary, and of those 88 percent voted in the Republican primary, and 12 percent in the Democratic. In the Republican primary, 52 percent voted for Donald Trump and 24 percent for Ted Cruz. COs have slightly less formal education than the average voter (76 percent hold an associate’s degree or less) and slightly more male (58 percent).
COs placed more emphasis on issues like the economy, terrorism, and jobs, and placed less emphasis on climate change, gay rights, gender equality, the environment, racial equality, and family and medical leave. They were somewhat more likely than their Conservative Younger counterparts to elevate the importance of Social Security and crime, while they were somewhat less likely to focus on taxes, immigration, or the size of government.
COs are conventional conservatives on economic questions: A plurality of 49 percent believes that taxes should not be raised on the wealthy, and 50 percent favor an expansion of trade (22 percent oppose it). They have a strong preference for a free market over an active government (79 to 13 percent) and believe that business is too heavily regulated as opposed to too lightly regulated by a lopsided margin of 76 to 6 percent. COs display almost as much uniformity as DILEs on immigration policy questions. Seventy-four percent of COs believe that illegal immigrants are mostly a drain on society, and 52 percent oppose a pathway to citizenship. Fifty-nine percent believe that immigration to America should be more difficult than it currently is (only 15 percent believe it should be easier), and 76 percent favor the proposed ban on Muslim immigration.
COs constitute 21 percent of the total electorate, making them the second largest of the five clusters. Eighty-eight percent of COs voted for Donald Trump in the 2016 election, and only 6 percent voted for Hillary Clinton.
This group looks a lot like the Conservative Older cluster with the primary exception being that they are younger: 42 percent of CYs are under the age of 45 compared to 20 percent of COs. They are just as Republican (52 percent versus 6 percent Democrat) and just as conservative (72 percent versus 3 percent liberal) as the COs. Sixty-five percent of this group voted in a primary — 93 percent in the Republican and 7 percent in the Democratic. In the Republican primary, 48 percent voted for Trump and 35 percent voted for Cruz. This indicates that CYs might be a bit more traditionally conservative than COs. Seventy-five percent of CYs are white (similar to DILEs). They are slightly more educated than COs as 33 percent of CYs have a bachelor’s degree or higher compared to 24 percent of COs. This is also the most heavily male of the five clusters with a 68 to 32 percent gender split.
CYs had more defined priorities than other groups, as twelve issues were more than one standard deviation either above or below the mean. They placed more emphasis on the economy, taxes, jobs, the budget deficit, the size of government, and terrorism. They placed less emphasis on racial equality, the environment, climate change, gender equality, gay rights, and poverty.
CYs are the most conservative group on the question of raising taxes on the wealthy with 70 percent opposed. Seventy-five percent of CYs believe that businesses are too heavily regulated, and 81 percent believe in the desirability of a free market economy (only 8 percent prefer a strong government). CYs also favor increasing trade by a margin of 52 to 24 percent, though a quarter is undecided on the question. CYs are a close match for COs in terms of their positions on various policy issues. Even more believe that illegal immigrants are more of a drain on society than a contribution (77 to 8 percent), and 71 percent oppose a pathway to citizenship. They favor a tightening rather than a loosening of American immigration law by a margin of 49 to 22 percent, and 72 percent favor a proposed ban on Muslim immigration.
CYs constitute only 12 percent of the total electorate, making them the smallest of the five clusters. Eighty-five percent of CYs voted for Donald Trump in the 2016 presidential election, and only 7 percent voted for Hillary Clinton.
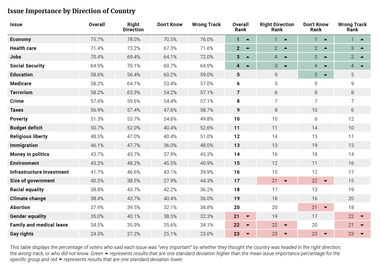
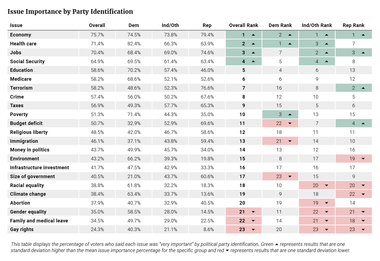
This table shows what percentage of voters in each party said an issue was “very important” (see Table A-2). As described earlier, the ranking columns are based on that percentage from highest to lowest. The color coding represents significant differences in how parties (and the overall electorate) define the importance of these issues relative to the importance they place on other issues in order to standardize differences across groups. Green represents issues that were chosen by a percentage of the group in question one standard deviation higher than the mean for issues for that specific group, and red represents results that are one standard deviation lower. For example, in Table A-2, 71 percent of Democrats said poverty was “very important” — a percentage at least one standard deviation above the mean percentage of Democrats saying any of these issues was “very important.” Using this methodology, the issues that are within one deviation of the mean represent about 68 percent of the issues while those at either end of the spectrum represent about 16 percent, giving a reasonable reflection of prioritization. An issue that appears as one deviation lower (red) than the mean does not mean the group thought it was not important, but rather in contrast to other issues it was less of a priority.
The economy was an issue with high importance across all parties. Beyond that, there were some differences. Democrats and Independents chose health care as one of their more important issues, while Republicans and Independents said jobs was one of their more important issues. After that were some interesting but not unexpected differences. Independents identified Social Security as one of their top issues, while Democrats focused on poverty, and Republicans on terrorism and the budget deficit.
At the other end of issue concerns, however, there were significant differences. There was some general agreement between Republicans and Independents, who put less emphasis on gay rights, family and medical leave, gender equality, and racial equality. For Republicans, they additionally placed less emphasis on climate change and the environment, while Independents focused less on abortion. Democrats, on the other hand, had no agreement with either Independents or Republicans on the issues that they emphasized less: size of government, immigration, and the budget deficit. Democrats particularly de-emphasized size of government, with this issue being ranked over two standard deviations (2.23) below the mean.
What Table A-2 reflects is differing priorities at a political party level, with the biggest differences centering on size of government, the budget deficit, climate change, the environment, terrorism, immigration, racial equality, and gender equality.
Table A-2
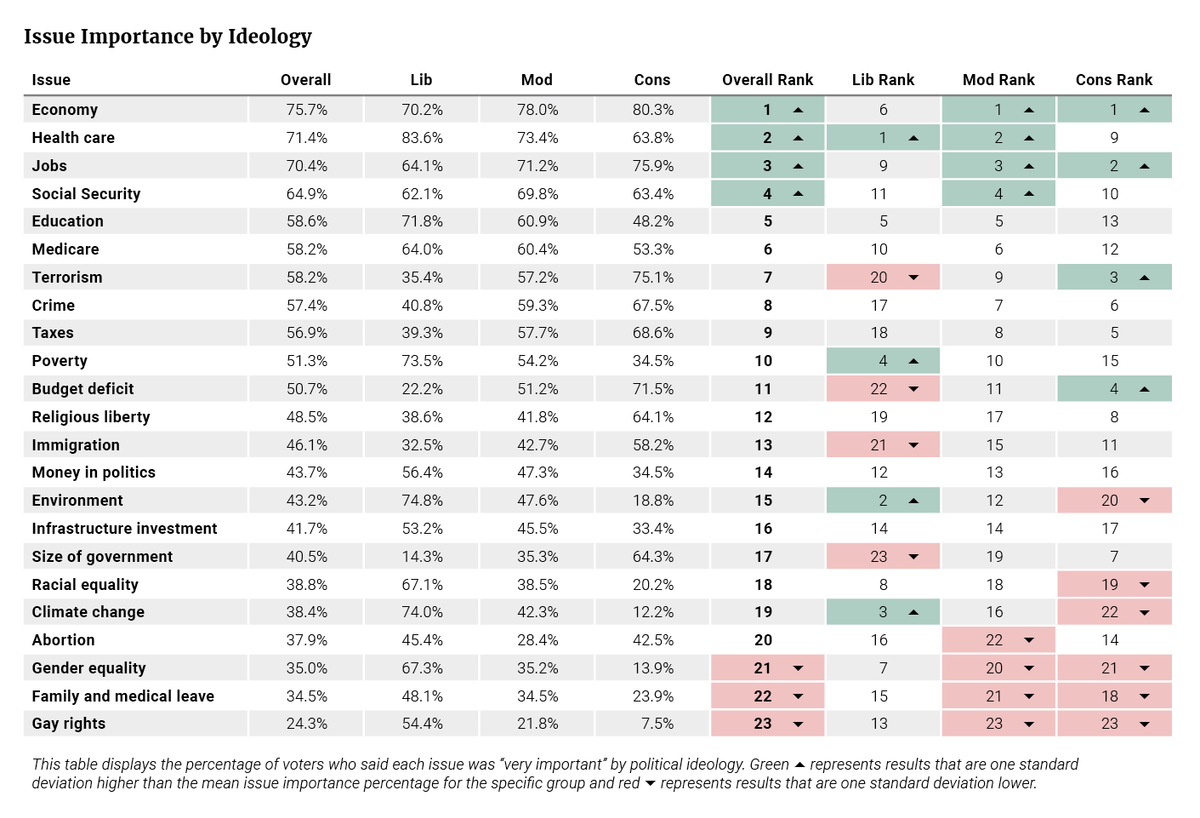
Next, and not surprisingly, looking at the issue priorities by ideology, there are some similar dynamics with liberals behaving like Democrats, moderates like Independents, and conservatives like Republicans (see Tables A-2 and A-3). Moderates’ issue priorities looked very similar to those of Independents. Their top four priorities nearly matched, with moderates swapping the order of health care and jobs. Moderates also matched the electorate as a whole in these top tier priorities and in general tracked the overall electorate closely.
Table A-3
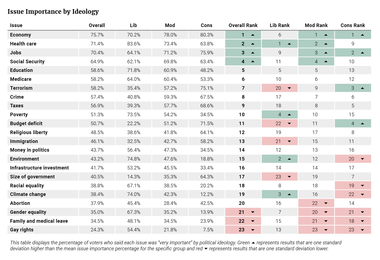
Liberals did differ in two significant respects from Democrats more broadly. First, the environment, not the economy, was their number two issue, followed by climate change (which came in ninth for Democrats) and then poverty (Democrats’ number three). Liberals had the economy as the sixth item on their priority list, while the other ideologies and the electorate as a whole had it as number one. Second, liberals had terrorism lower on their priority list at 20th out of 23 issues, while Democrats had it at 16. Finally, conservatives tracked closely with Republicans, inverting the order of terrorism and jobs.
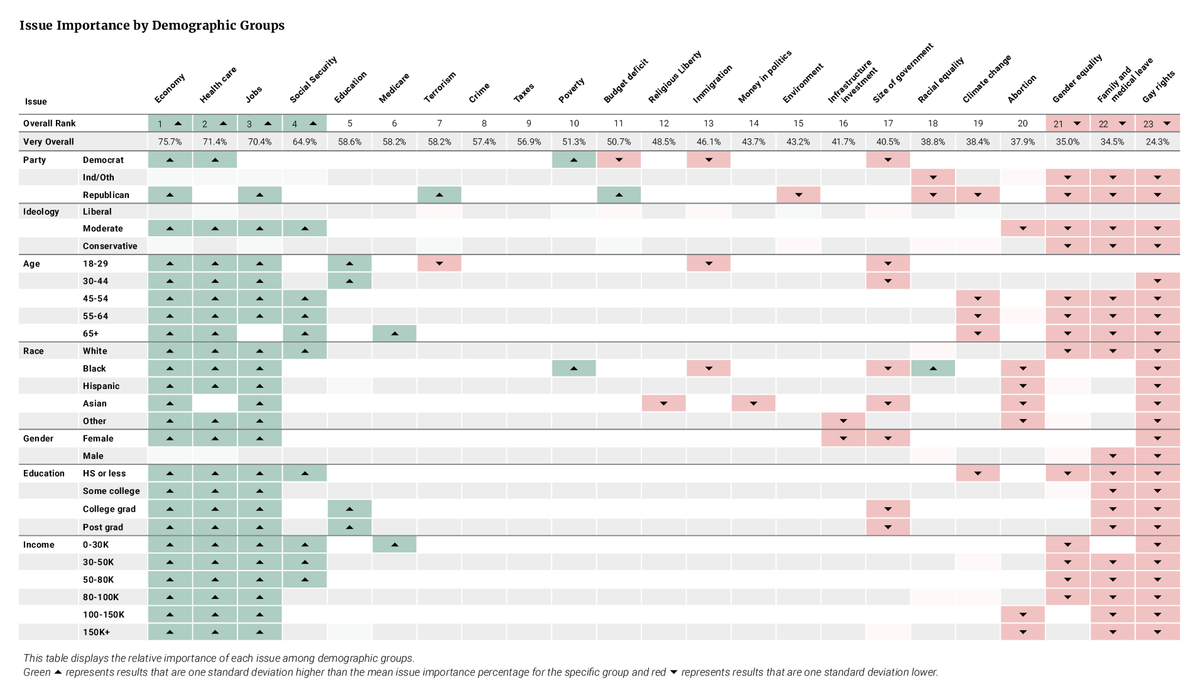
Looking at issue priorities based on other demographics — including age, race, gender, education, and family income — did not yield the same clear divergences as party and ideology did, though there were some noticeable differences between groups.
Table A-4
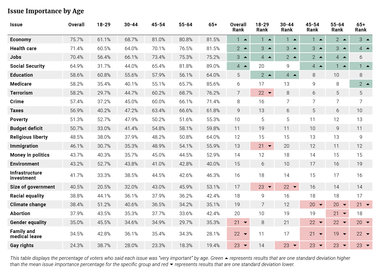
Issue priority was remarkably similar across ages (see Table A-4), with the exception of the youngest voter cohort, 18 to 29 year olds. Most ages shared the economy, health care, and jobs being in the top four concerns with only seniors not including jobs, which makes sense given they are at the end of their working careers. Other issue priorities were similarly intuitive — seniors included Medicare, voters over age 45 agreed on Social Security, and younger voters chose education to round out their top four. Where younger voters really differed was on the issues they placed less emphasis on, which included immigration, size of government, and terrorism. These issues were much higher on the list for older voters. Young voters also prioritized climate change to a noticeably greater degree than did voters over age 45.
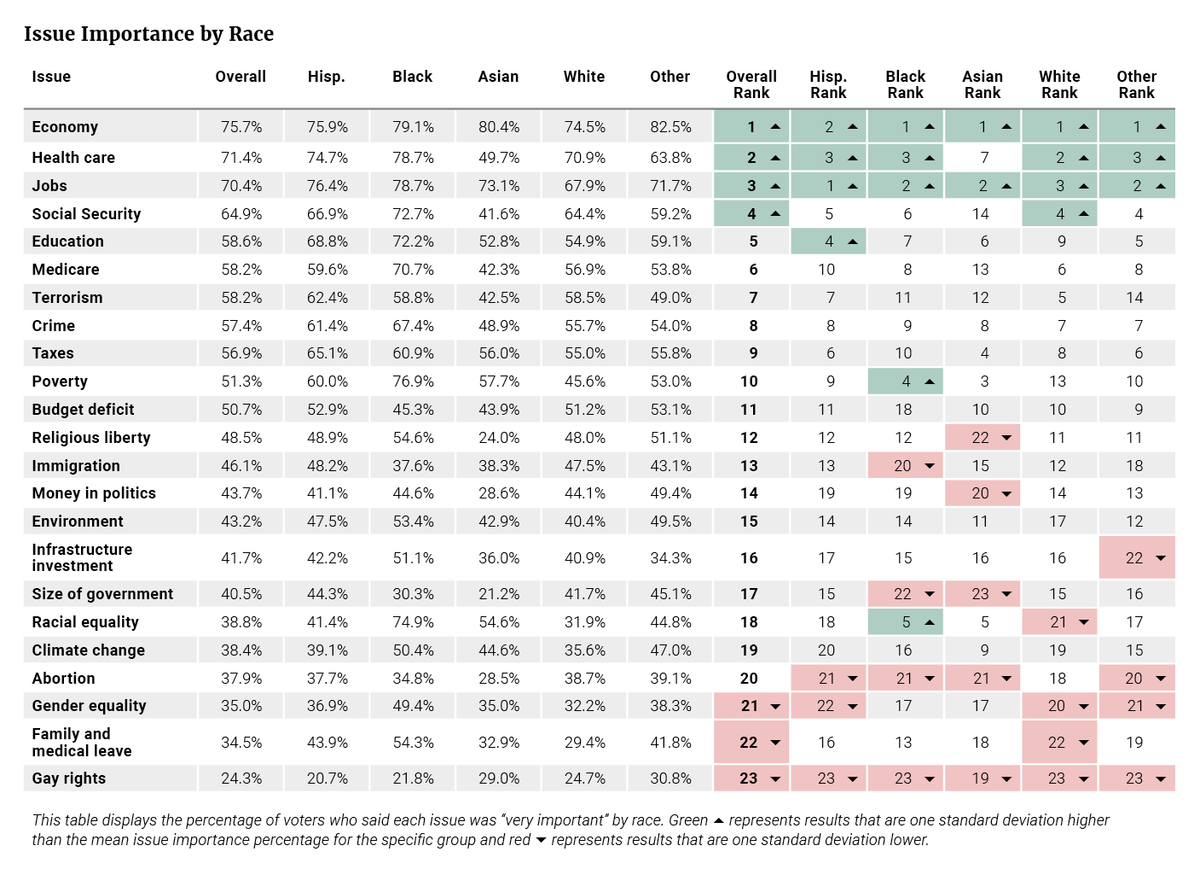
Table A-5
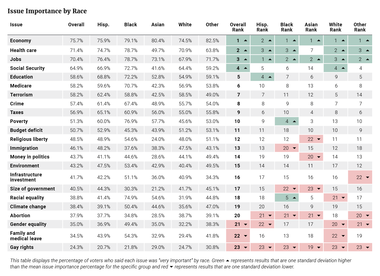
Looking at these issue rankings by race (see Table A-5), there were some striking differences. While all racial groups (with the exception of Asians, who listed poverty as their number three issue) included the same top three items — economy, health care, and jobs, with differences only in order, differences emerge after this top tier. Hispanic voters were additionally concerned about education. For black voters, poverty was also a major concern, as was racial equality. For white voters, Social Security was a top issue. In the issues at the other end of the spectrum, there were similarly serious differences. While gay rights and abortion were at least a standard deviation lower than average for all racial groups, other issues were more divided. Size of government was low on the list for black and Asian voters, as was immigration for black voters, religious liberty, and money in politics for Asian voters, gender equality for Hispanics and whites, and racial equality and family and medical leave for white voters.
Table A-6
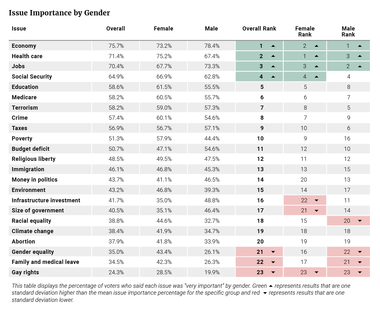
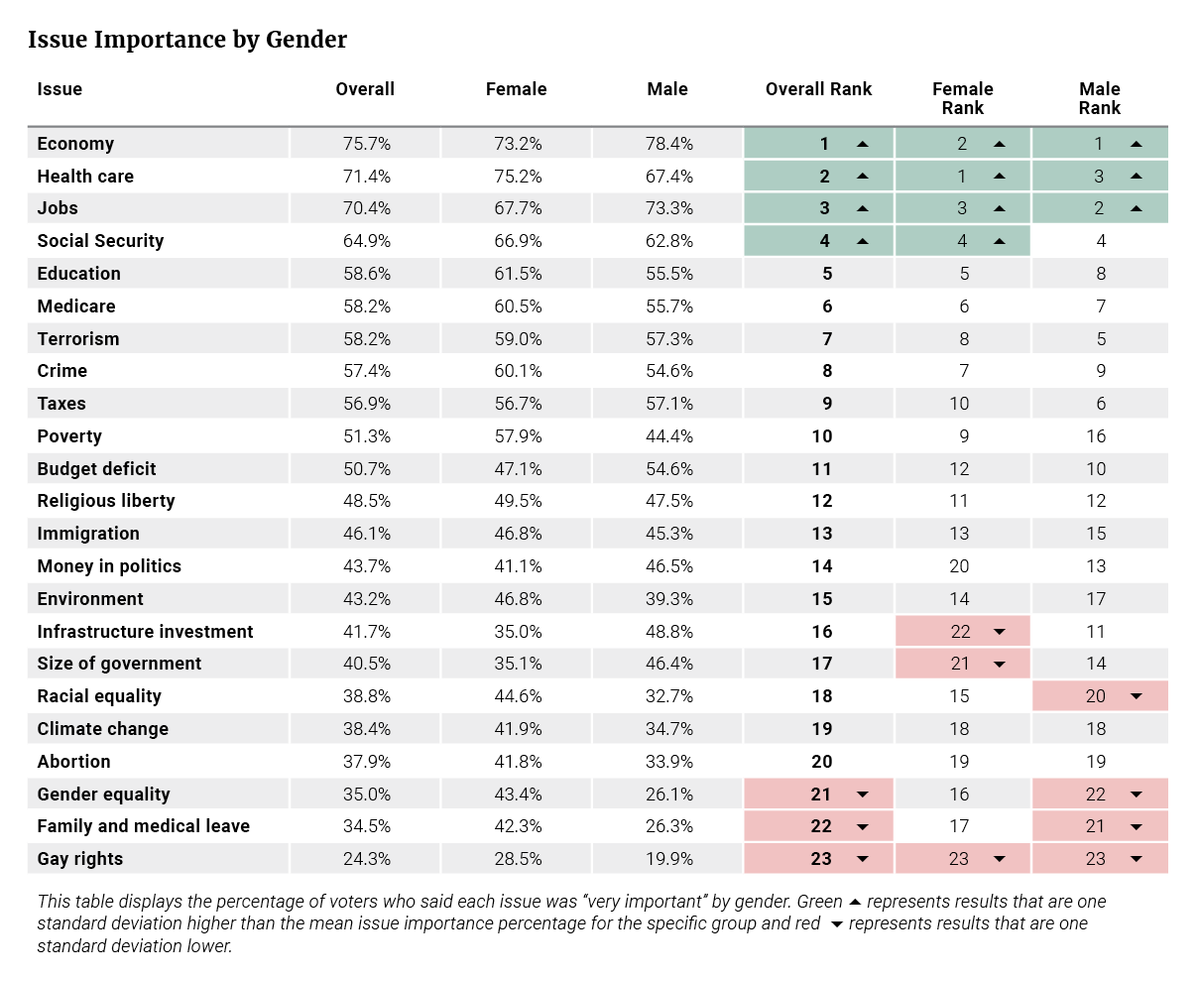
Looking at gender, men placed less emphasis on gender equality, family and medical leave, and racial equality, while women placed less emphasis on infrastructure investment and size of government. While differences exist on these issues, they are all outside the top 10 for either gender. And across the top 10 issues for each gender, there was a good deal of consistency, prioritizing such items as the economy, jobs, health care, Social Security, education, Medicare, terrorism, and crime (see Table A-6).
Table A-7
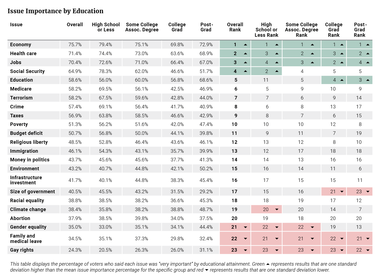
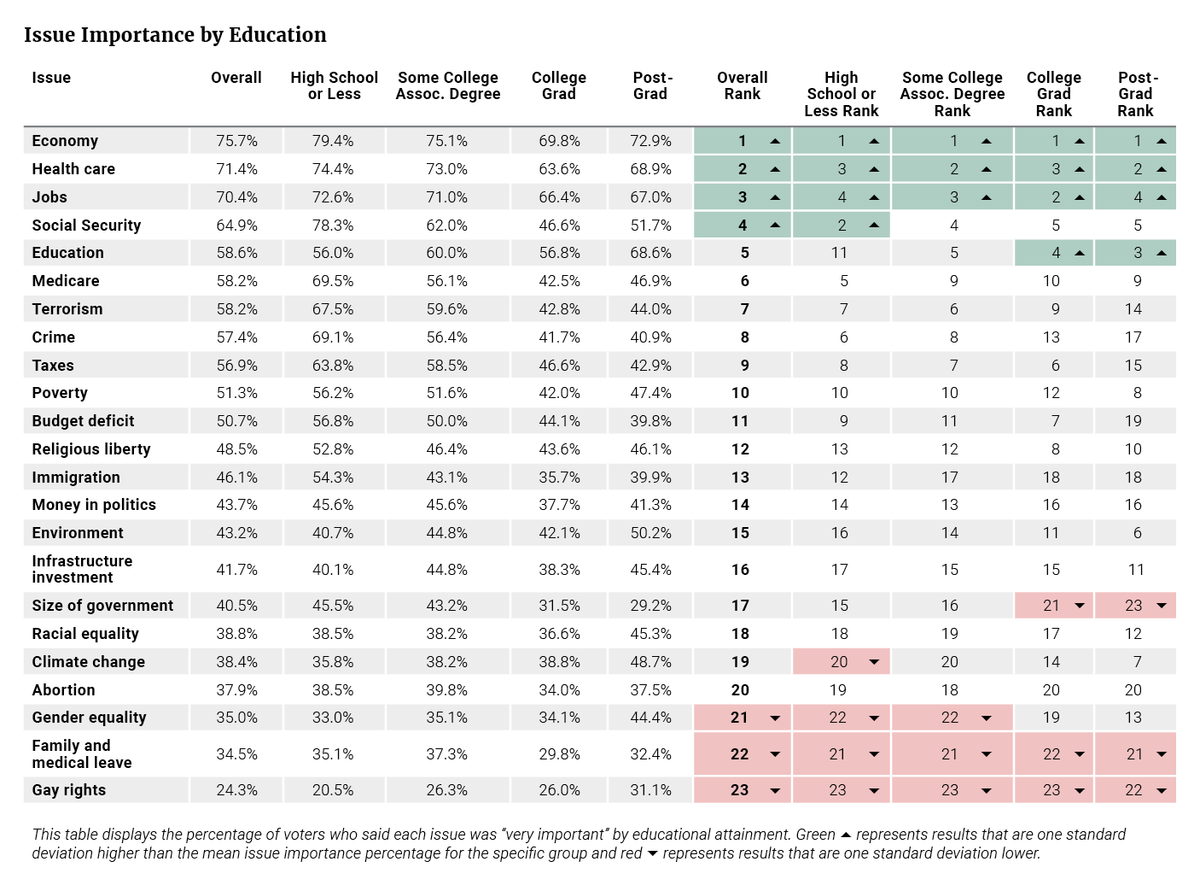
Similarly, issues varied little across education demographics (see Table A-7). Those with higher education were more focused on education, and less on size of government, while those with lower education levels were not focused on gender equality or climate change, both in comparison to their own issue priority list and in contrast to those in the post-graduate category.
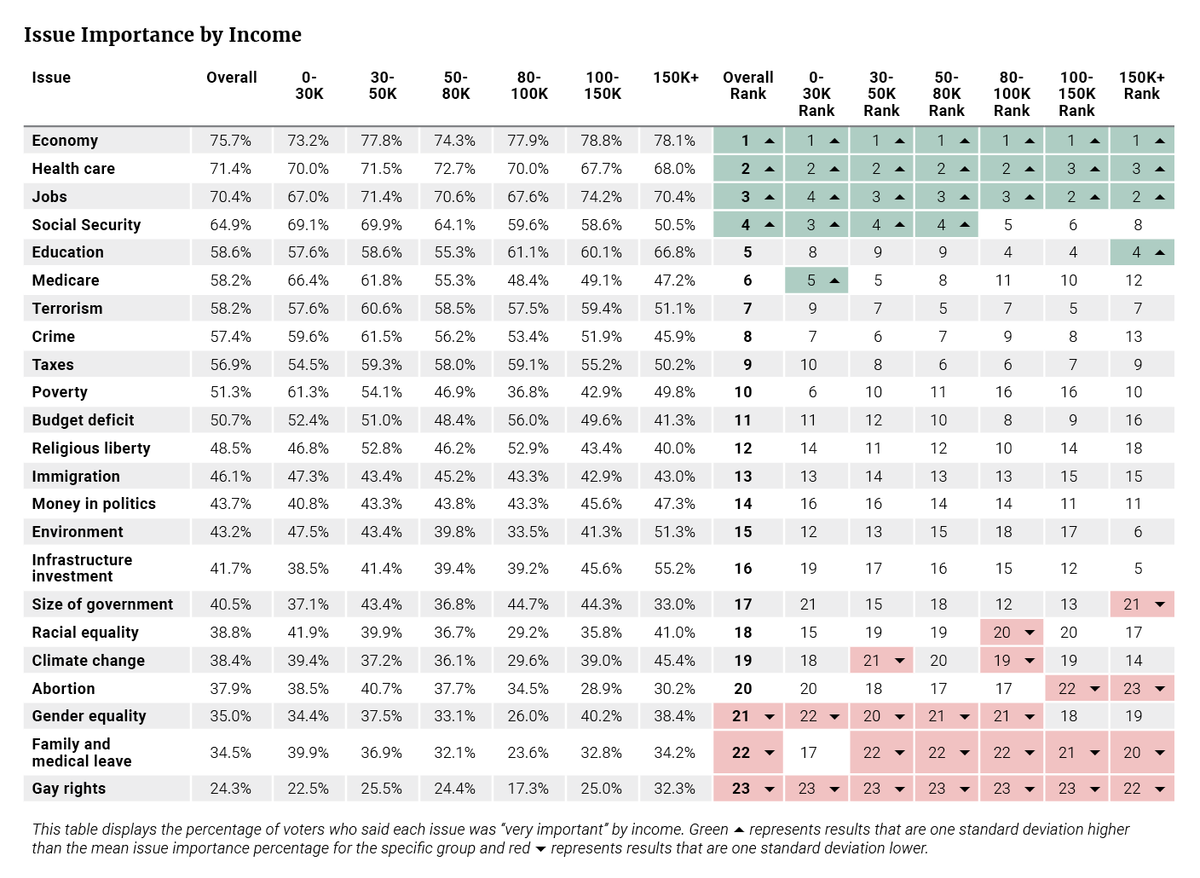
Issue priorities across income levels were also similar in terms of the highest priority issues (see Table A-8), with fairly broad agreement on the top three. The highest income bracket also strongly emphasized education, while the lowest was focused on Medicare. At the bottom of the list, the most striking differences included family and medical leave. While a bottom tier priority for most income groups, it was middle-of-the-road for those making under $30,000 a year. The highest income brackets placed less emphasis on abortion and size of government as priorities.
Table A-8

Table A-9
Throughout this report, the term “black” is used instead of African-American to maintain fidelity with the question responses for race in the 2016 VOTER Survey (Views of the Electorate Survey).
Emily O’Connor, Andrew Pardue, and Caitlin Peartree made significant contributions in both the data analysis and writing of this report.


Subscribe to our mailing list for updates on new reports, survey data releases, and other upcoming events.


