
Democrats should stop worrying about the Electoral College
The Hill May 16, 2019

Key Findings
More than two years ago, Donald Trump’s entry into American politics culminated with an unlikely Electoral College win and his inauguration as president. This Democracy Fund Voter Study Group brief gives an overview of how opinions have changed during this period and what voters are looking for in future candidates. It is based on the January 2019 VOTER Survey (Views of the Electorate Research Survey) of 6,779 Americans, most of whom had been surveyed previously as part of a longitudinal panel.
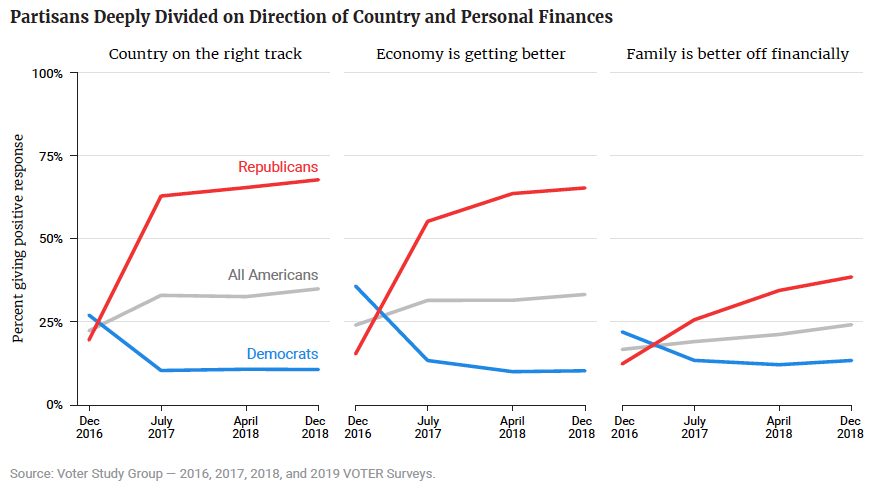
Overall, Americans are more optimistic about the direction of the country than they were directly after the 2016 presidential election. Since 2016, the VOTER Survey has asked questions that tap into Americans’ views of the trajectory of the country, the country’s economy, and their personal finances:
On all three questions, Americans are now more likely to respond positively than they were in the December 2016 VOTER Survey. Americans today are now more likely to say that the country is on the right track (22 percent in 2016 vs. 35 percent in 2019), that the economy is getting better (24 percent vs. 33 percent), and that their family is better off financially than it was a year ago (17 percent vs. 24 percent).
However, this uptick conceals the separate trajectories for Republicans and Democrats. Consistent with previous political science research, partisanship has strongly affected how Americans’ views have evolved over the past two years. Americans who share the party of the president are more likely to respond positively to these questions than those who are of the opposite party.(i)
Compared to December 2016, Republicans are much more likely to say the country is headed in the right direction (20 percent in 2016 vs. 68 percent in 2019), that the economy is getter better (15 percent vs. 65 percent), and that their family is better off financially (12 percent vs. 39 percent).(1) While the majority of these shifts occurred between the December 2016 and July 2017 VOTER Surveys, the number of Republicans giving a positive response has continued to increase since July 2017.
(1) Throughout this report, “Republicans” and “Democrats” refers to those who identify with the party as well as Independents who say they lean towards that particular party.
Figure 1
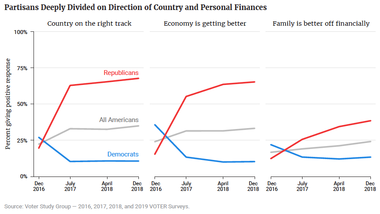
By contrast, Democratic evaluations have become more pessimistic — with fewer saying that the country is headed in the right direction (27 percent in 2016 vs. 11 percent in 2019), that the economy is getting better (36 percent vs. 10 percent), and that their family is better off financially (22 percent vs. 13 percent).
Notably, these Democratic assessments have been relatively stable since July 2017 despite a growing economy and falling unemployment rates. This is consistent with other research that suggests that other assessments like presidential approval have become untethered from the country’s economic condition.(ii)
The views of independents during this period mirror those of all Americans, but are slightly more pessimistic overall. They are now more likely to say that the country is on the right track (17 percent in 2016 vs. 31 percent in 2019), that the economy is getting better (14 percent vs. 27 percent), and that their family is better off financially than it was a year ago (13 percent vs. 23 percent).
Americans are more likely to report negative emotions when they think about politics these days. Almost three-quarters (74 percent) say they feel disgusted, while more than half report feeling angry (65 percent), sad (60 percent), or anxious (56 percent). By contrast, nearly one-third (30 percent) say they feel hopeful when they think about politics and just 22 percent say they feel enthusiastic.(2)
This negative orientation cuts across partisan lines. Both Democrats and Republicans are more likely to report feeling disgusted (80 percent of Democrats and 68 percent of Republicans), angry (74 percent and 58 percent), sad (69 percent and 53 percent), and anxious (67 percent and 45 percent) than they are to report feeling hopeful (25 percent and 39 percent) or enthusiastic (19 percent and 28 percent). To the extent that there are differences, they mirror the gaps in partisan economic evaluations — with Republicans being more likely to report positive emotions and Democrats being more likely to report negative emotions.
(2) Respondents were asked about these emotions on a scale of 1 (“do not feel at all”) to 7 (“feel very strongly”). In this section, we report on the percent of people answering 5 or higher.
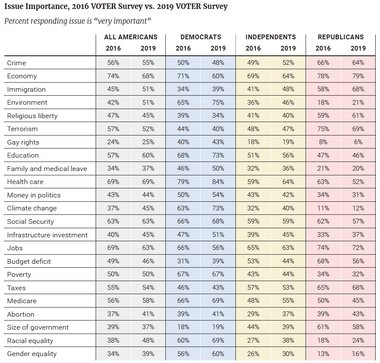
In 2019, the VOTER Survey asked Americans how important the following issues were to them:
|
|
|
In the aftermath of the 2018 midterm elections, Americans were more likely to say that health care (69 percent), the economy (68 percent), jobs (63 percent), Social Security (63 percent), and education (60 percent) were very important issues. By contrast, they were less likely to prioritize abortion (41 percent), gender equality (39 percent), the size of government (37 percent), family and medical leave (37 percent), and gay rights (25 percent). (See Appendix for a full list of results.)
Figure 2
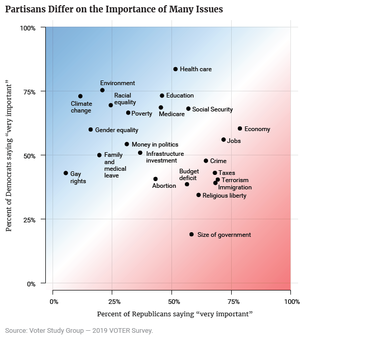
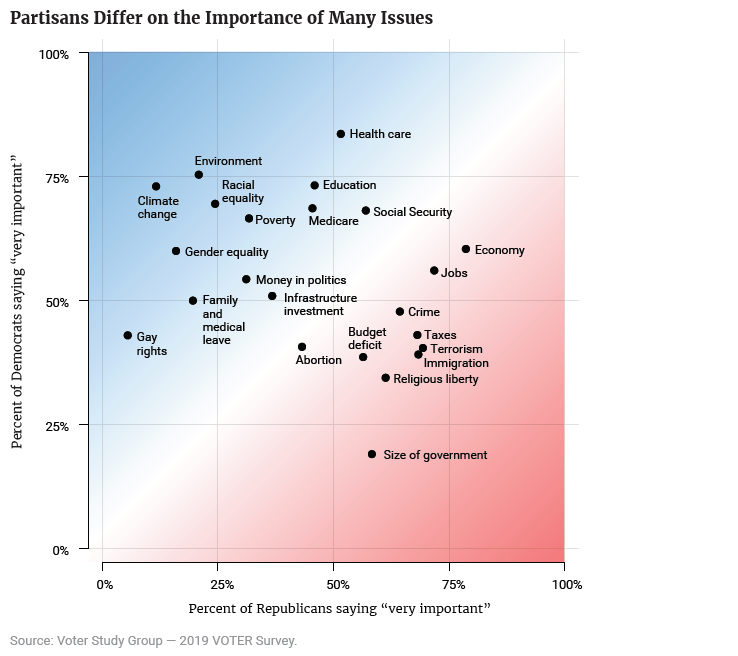
There are deep divides on how partisans prioritize issues. Consistent with other research, the largest partisan divide is around climate change.(iii) While almost three-quarters (73 percent) of Democrats say climate change is “very important,” just 12 percent of Republicans share that sentiment.
Democrats are also notably more likely than Republicans to prioritize the environment (75 percent vs. 21 percent), racial equality (69 percent vs. 24 percent), gender equality (60 percent vs. 16 percent), gay rights (43 percent vs. 6 percent), poverty (67 percent vs. 32 percent), health care (84 percent vs. 52 percent), family and medical leave (50 percent vs. 20 percent), and education (73 percent vs. 46 percent).
By contrast, Republicans are more likely than Democrats to prioritize the size of government (58 percent vs. 19 percent), immigration (68 percent vs. 39 percent), terrorism (69 percent vs. 40 percent), religious liberty (61 percent vs. 34 percent), and taxes (68 percent vs. 43 percent). (See Appendix for a full list of results.)
Independents generally prioritize these issues at levels somewhere between Democrats and Republicans.(3) However, issue-by-issue they are sometimes significantly closer to one group of partisans. Their prioritization of religious liberty, terrorism, immigration, and the economy is more like Democrats, while their prioritization of racial equality, gender equality, gay rights, and poverty is more like Republicans.
(3) The only exception to this is abortion, where both Democrats and Republicans are more likely to prioritize this issue than independents. See Appendix for full results.
The questions about issue importance were also asked in the 2016 VOTER Survey. By and large, Americans’ prioritization of issues looks roughly the same in 2019 as it did just after the 2016 presidential election.
That said, there have been relative increases and drops in the importance of some issues.(4) Compared to 2016, Americans are now less likely to say that the economy (74 percent in 2016 vs. 68 percent in 2019) and jobs (69 percent vs. 63 percent) are “very important” issues. By contrast, Americans are now more likely to say that immigration (45 percent vs. 51 percent), the environment (42 percent vs. 51 percent), infrastructure investment (40 percent vs. 45 percent), racial equality (38 percent vs. 48 percent), climate change (37 percent vs. 45 percent), and gender equality (34 percent vs. 39 percent) are “very important” issues.
These shifts were not the same for Democrats and Republicans. Even prior to a Green New Deal resolution being introduced in early February 2019, Democrats had already shifted on environmental issues. Compared to 2016, Democrats are now more likely to say that environmental issues (65 percent vs. 75 percent) and climate change (63 percent vs. 73 percent) are “very important.” Democrats also became more likely to prioritize health care (79 percent vs. 84 percent), education (68 percent vs. 73 percent), and the budget deficit (31 percent vs. 39 percent).
Democrats and Republicans are both now more likely to say that immigration and racial equality are more important issues than they were two years ago.
Compared to 2016, Democrats are now less likely to say the economy (71 percent vs. 60 percent) and jobs (66 percent vs. 56 percent) are “very important issues.” Among Republicans, terrorism (75 percent vs. 69 percent), the budget deficit (68 percent vs. 56 percent), health care (63 percent vs. 52 percent), and Social Security (62 percent vs. 57 percent) are now seen as less important.
(4) This section focuses on changes that are both statistically significant and substantive. “Substantive” here being a shift of five percentage points or more.
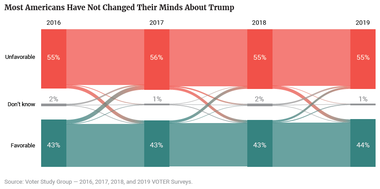
Despite a growing and healthy economy, more than half (56 percent) of Americans say they have an “unfavorable” opinion of the president. Just 4 in 10 (40 percent) report a “favorable” opinion. These numbers have only changed slightly since the 2016 VOTER Survey, when 52 percent held an “unfavorable” opinion and 44 percent held a “favorable” opinion.
Notably, there are now almost twice as many Americans with a “very unfavorable” opinion of the president than there are those with a “very favorable” opinion (49 percent vs. 25 percent).
Today, the overwhelming majority (92 percent) of Democrats have an “unfavorable” opinion of President Trump while a similar number (86 percent) of Republicans have a “favorable” opinion. If anything, partisan opinions have only solidified since 2016, when 88 percent of Democrats held an “unfavorable” view and 82 percent of Republicans held a “favorable” view. Although independents are more balanced in their judgment of the president, they have a more “unfavorable” opinion of him as of the 2019 VOTER Survey (51 percent) than they did in 2016 (45 percent).
Even among partisans, positive views of President Trump are softer than negative views. Democrats are much more likely to have a “very unfavorable” opinion of the president than Republicans are to have a “very favorable” opinion (86 percent vs. 56 percent).
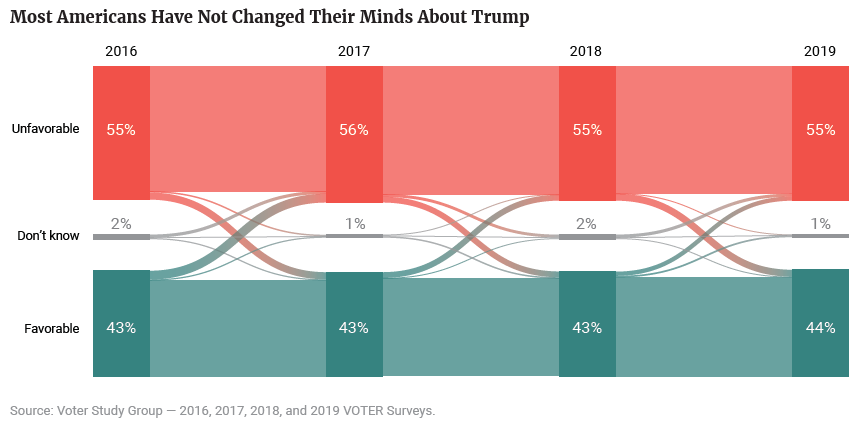
As has been noted throughout his presidency, sentiments towards President Trump seem remarkably stable given the often tumultuous nature of his time in office. One open question is how much of this stability comes from consistent coalitions of people holding the same opinion of President Trump over time versus shifting coalitions where gains and losses with different groups are roughly balanced.
Using data from past waves of the VOTER Survey, it is clear that the overwhelming majority (85 percent) of Americans have consistently held the same view about President Trump over the last two years. Since the 2016 presidential election, almost half (48 percent) of Americans have had a consistently “unfavorable” view of President Trump. By contrast, just over one-third (36 percent) have had a consistently “favorable” opinion of the president. Only 15 percent of Americans have changed their view at some point — having some combination of “favorable” views or “unfavorable” views, or saying they “didn’t know” over this time period.
Figure 3
Overall, just about half (49 percent) of Americans have at some point in the past two years expressed a favorable opinion of the president. While President Trump’s remarkably stable approval and favorability numbers have often been cited as a “floor,” these 49 percent of Americans might represent his “ceiling.” Assuming that President Trump was able to regain a favorable rating from every American who had previously offered a positive opinion of him in the last two years, this would still only represent about half of Americans.
Americans’ voting behavior in the past two presidential elections also provides a useful lens for understanding shifts in President Trump’s favorability.
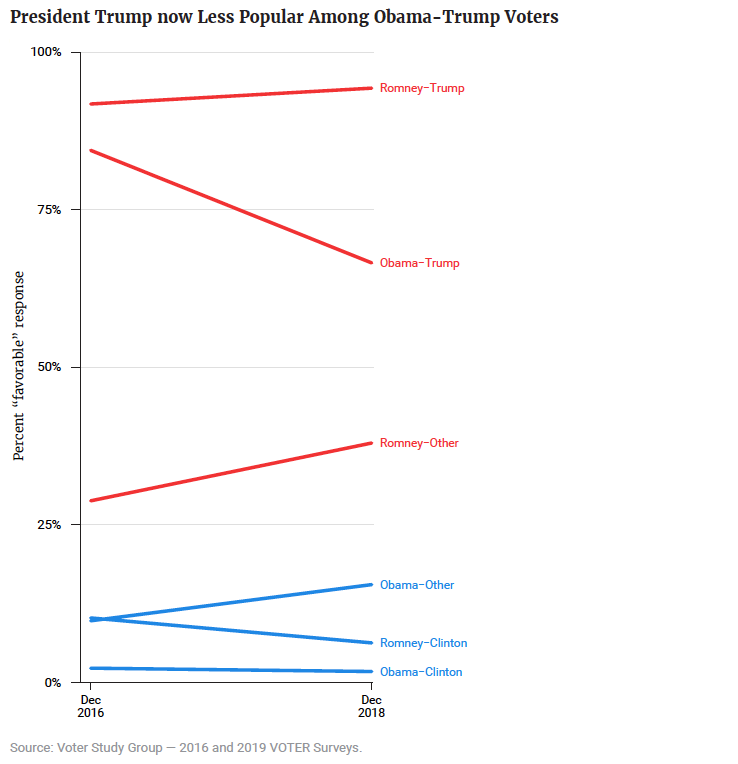
Today, an overwhelming majority (93 percent) of people who voted for Sen. Mitt Romney in 2012 and Trump in 2016 and two-thirds of Obama-Trump voters (66 percent) have a “favorable” opinion of the president. By contrast, just 38 percent of Romney-third-party voters and 15 percent of Obama-third-party voters share this sentiment. Just 6 percent of Romney-Clinton and 2 percent of Obama-Clinton voters have a “favorable” view of President Trump.
Figure 4
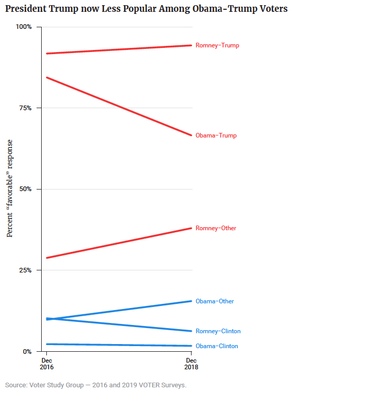
Only Obama-Trump voters have had a significant change in their view of President Trump over the last two years. In the 2016 VOTER Survey, more than 8 in 10 (85 percent) Obama-Trump voters held a “favorable” view of the president — 19 percentage points higher than in 2019 (66 percent). Even small movement among these voters — who represented 5 percent of voters in 2016 — may prove significant heading into the 2020 presidential election.(iv) Obama-Trump voters are also disproportionately white, non-college educated and, as a result, are likely to be well distributed geographically for the purpose of electoral impact.
All other shifts among voting groups are not statistically significant.
With the 2018 midterm elections completed and the 2020 presidential primary season already beginning, we asked Americans if it is important that the next president have certain characteristics. Generally, respondents cared more about the policy positions of presidential candidates than their demographic characteristics or social identities.
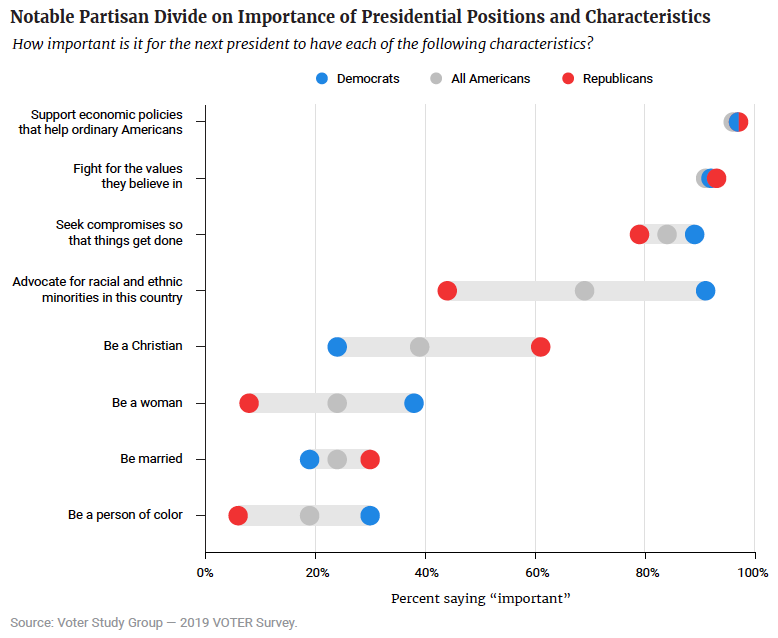
Overwhelming majorities think it is “important” that the next president support economic policies that help ordinary Americans (96 percent), fight for the values they believe in (91 percent), and seek compromise so that things get done (84 percent). About two-thirds (69 percent) say that it is “important” that they advocate for racial and ethnic minorities in this country.
By contrast, Americans do not think it is as important that the next president have particular demographic characteristics. About 4 in 10 (39 percent) say it is “important” that the next president is Christian, while about a quarter say it is “important” that she is a woman (24 percent), or that he or she is married (24 percent). Just 19 percent of Americans think it is important that the next president is a person of color.
Partisans are generally divided over the importance of these presidential characteristics. While an overwhelming majority (91 percent) of Democrats say that it is “important” that the next president advocates for racial and ethnic minorities, just under half (44 percent) of Republicans share this sentiment. Additionally, Democrats are about five times more likely than Republicans to say that it is “important” that the next president is a woman (38 percent vs. 8 percent) or a person of color (30 percent vs. 6 percent). Though overwhelming majorities of Democrats and Republicans say that the next president should compromise so that things get done, Democrats are still somewhat more likely than Republicans to express that sentiment (89 percent vs. 79 percent).
By contrast, Republicans are more likely than Democrats to say it is “important” that the next president be Christian (61 percent vs. 24 percent) or married (30 percent vs. 19 percent).
Republicans and Democrats are almost equally as likely to say that it is “important” that the next president support economic policies that help ordinary Americans (97 percent vs. 96 percent) and fight for values they believe in (93 percent vs. 92 percent).
Figure 5

There are also notable demographic divides on some of these characteristics. Women are more likely than men to say that it is “important” that the next president is a woman (29 percent vs. 20 percent). This nine-percentage-point gender gap is notably smaller than the divide between Democrats and Republicans (30 percentage points). Among Democrats, women are somewhat more likely to express this sentiment (41 percent vs. 33 percent), while among Republicans this gender gap is much smaller (9 percent vs. 6 percent).
When it comes to the 2020 presidential race, black Americans are more likely than any other racial or ethnic group to say it is “important” that the next president be a person of color. While almost 4 in 10 (39 percent) black Americans express this sentiment, only about a quarter of Hispanic (26 percent) and Asian (26 percent) Americans say the same. Just 14 percent of white Americans say that it is “important” that the next president is a person of color.
There are also significant religious divides on the importance of a Christian president. More than three-quarters (76 percent) of white evangelical Protestants and almost two-thirds (63 percent) of black Protestants say it is “important” that the next president is Christian. This is notably higher than the number of Mormons (46 percent), Catholics (44 percent), white mainline Protestants (37 percent), religiously unaffiliated Americans (16 percent), and Jews (5 percent) who say the same.
Updated May 9, 2019.


Subscribe to our mailing list for updates on new reports, survey data releases, and other upcoming events.
