
Polling: Trump Approval Rating Marks A Historic Low
Opposing Views September 18, 2017

In December 2016, analysts and scholars from across the political spectrum convened as the Democracy Fund Voter Study Group and helped construct the VOTER Survey. This longitudinal survey interviewed 8,000 Americans who had also been interviewed in 2011 and 2012, providing unique insights into the evolving views of voters.
In July 2017, 5,000 of these respondents were once again interviewed to track their opinions on specific issues, as well as to be asked new questions about topics important to the first months of the Trump administration.
While researchers will be releasing reports examining this rich data source in the coming months, here we highlight some of the most striking initial findings.
Trump voters still support the President, but support is weaker among Obama-Trump voters.
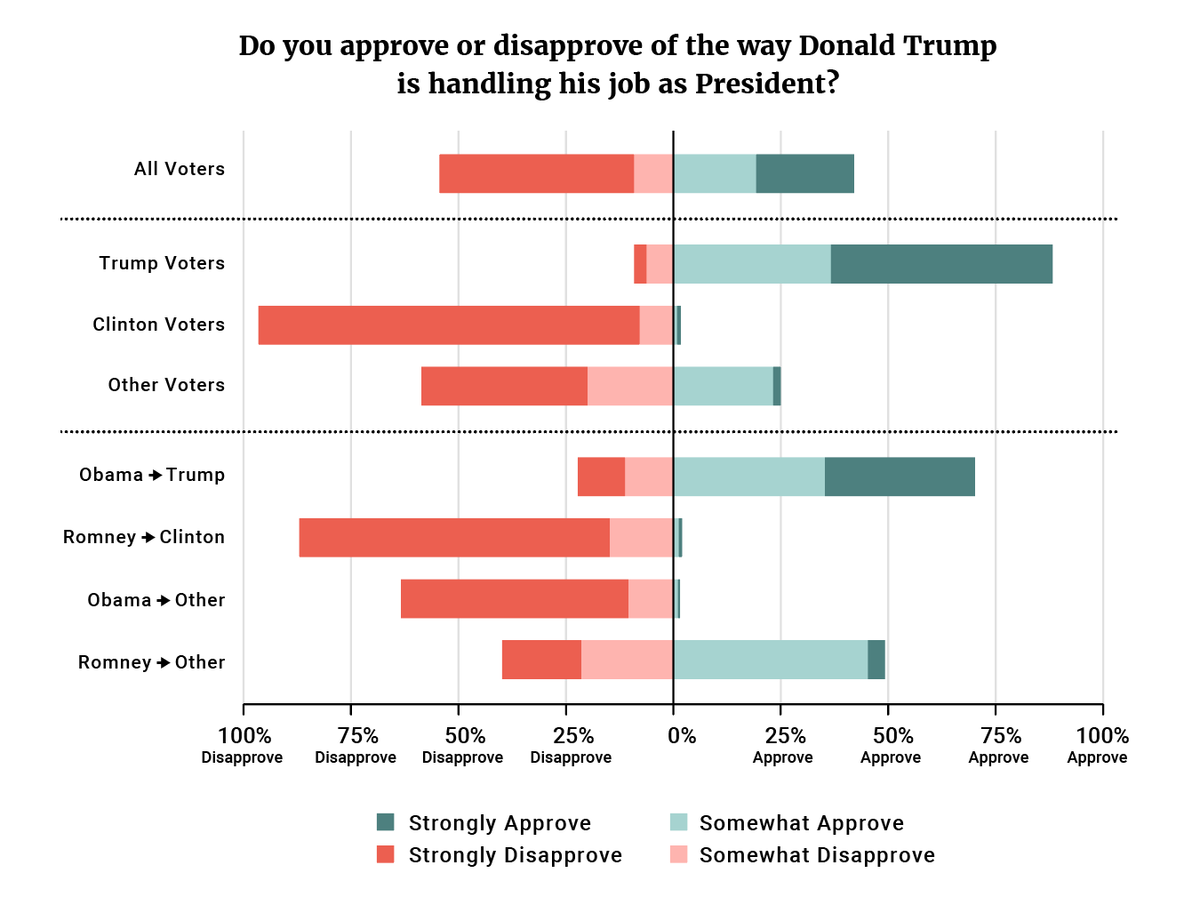
Since his inauguration in January, Trump’s approval ratings have declined. Estimates vary somewhat, but major poll aggregators all agree that Trump’s net approval — the percentage of voters who approve of the job he is doing minus the percentage of voters who disapprove — dropped about 15 points between inauguration and early July. In line with those results, Trump’s net approval in the VOTER Survey was -12 (42 percent approve vs. 54 percent disapprove).
The intensity of Trump disapproval is stronger than the intensity of approval. Trump supporters are almost evenly distributed among those saying they “strongly” and “somewhat” approve of him, while Trump detractors mostly say that they “strongly disapprove.”
Figure 1

Trump’s approval rating remains high among those who voted for him in November, based on their stated preference in the December 2016 survey. Eighty-eight percent still approve of the President while just 9 percent disapprove. Unsurprisingly, the vast majority of Clinton voters (96 percent) disapprove of Trump. Third-party voters are more divided. More disapprove of the president (59 percent) than support him (25 percent). Only 2 percent of third-party voters strongly approve of him.
Because our survey also interviewed respondents in November 2012, we can ascertain Trump’s standing among those who voted for one party’s candidate in 2012 and another party’s candidate in 2016. Among Romney-Clinton voters, 87 percent disapprove of Trump and only 2 percent approve. Similarly, 63 percent of voters who voted for Obama in 2012 but voted third party in 2016, disapprove of Trump. Voters who voted for Romney and then a third party are more likely to support Trump, but only barely (49 percent approve and 40 percent disapprove).
Perhaps most notable are the Obama-Trump voters. Although the majority (70 percent) approves of Trump’s job performance, 22 percent disapprove — a rate twice as high as that of all Trump voters.
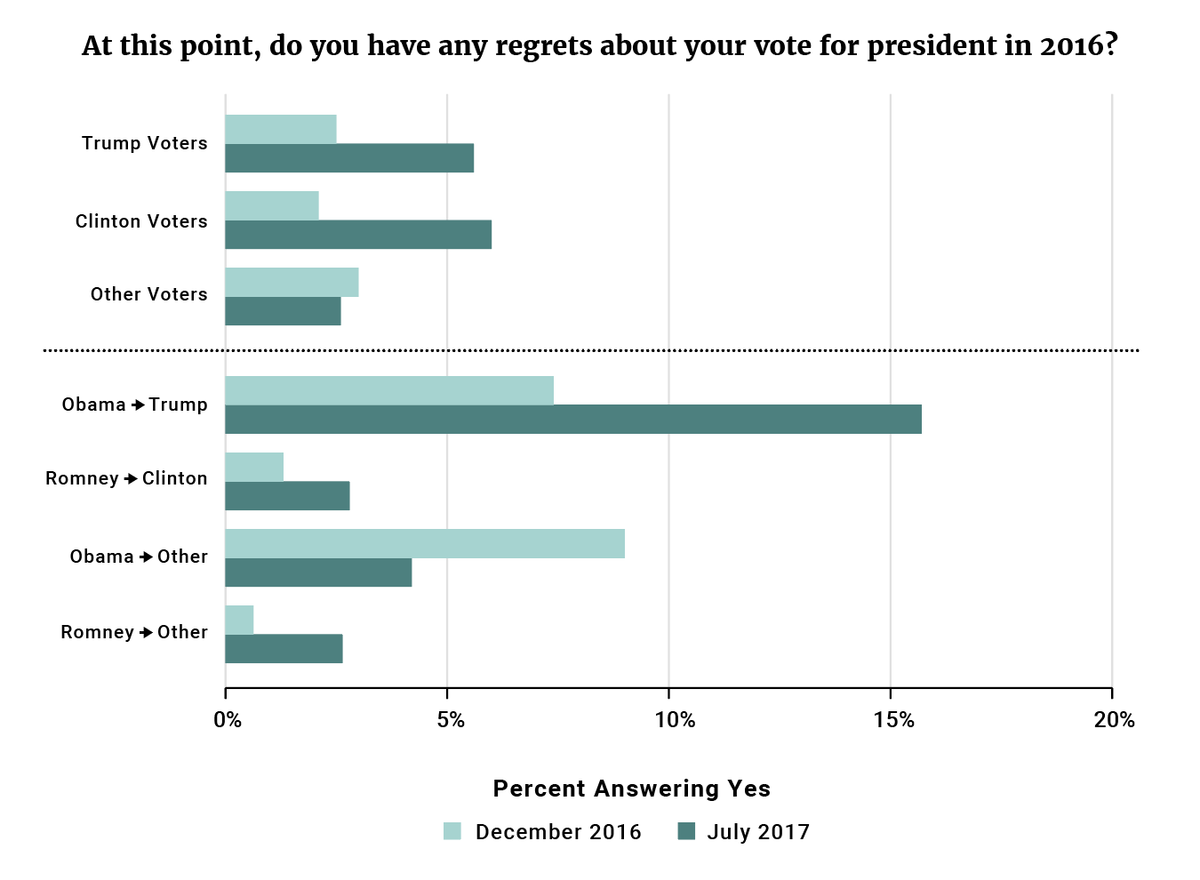
Very few voters regret the choices they made in 2016, but Obama-Trump voters are a notable exception.
The strong partisanship evident in voters’ views of Trump is also reflected in whether individuals regret the decisions they made in November. Overall, very few of those who report voting in the election say that they have regrets (6 percent). This is only slightly higher than when these respondents were interviewed in December 2016 (3 percent). The vast majority of voters would vote the same way given a second chance.
Trump and Clinton voters are similar: 6 percent of both groups regret the vote they made in November. Only about 3 percent of third-party voters express similar regrets. However, 16 percent of Obama-Trump voters regret voting for Trump — the highest of any group examined here. By contrast, only 3 percent of Romney-Clinton voters regret voting for Clinton.
Figure 2

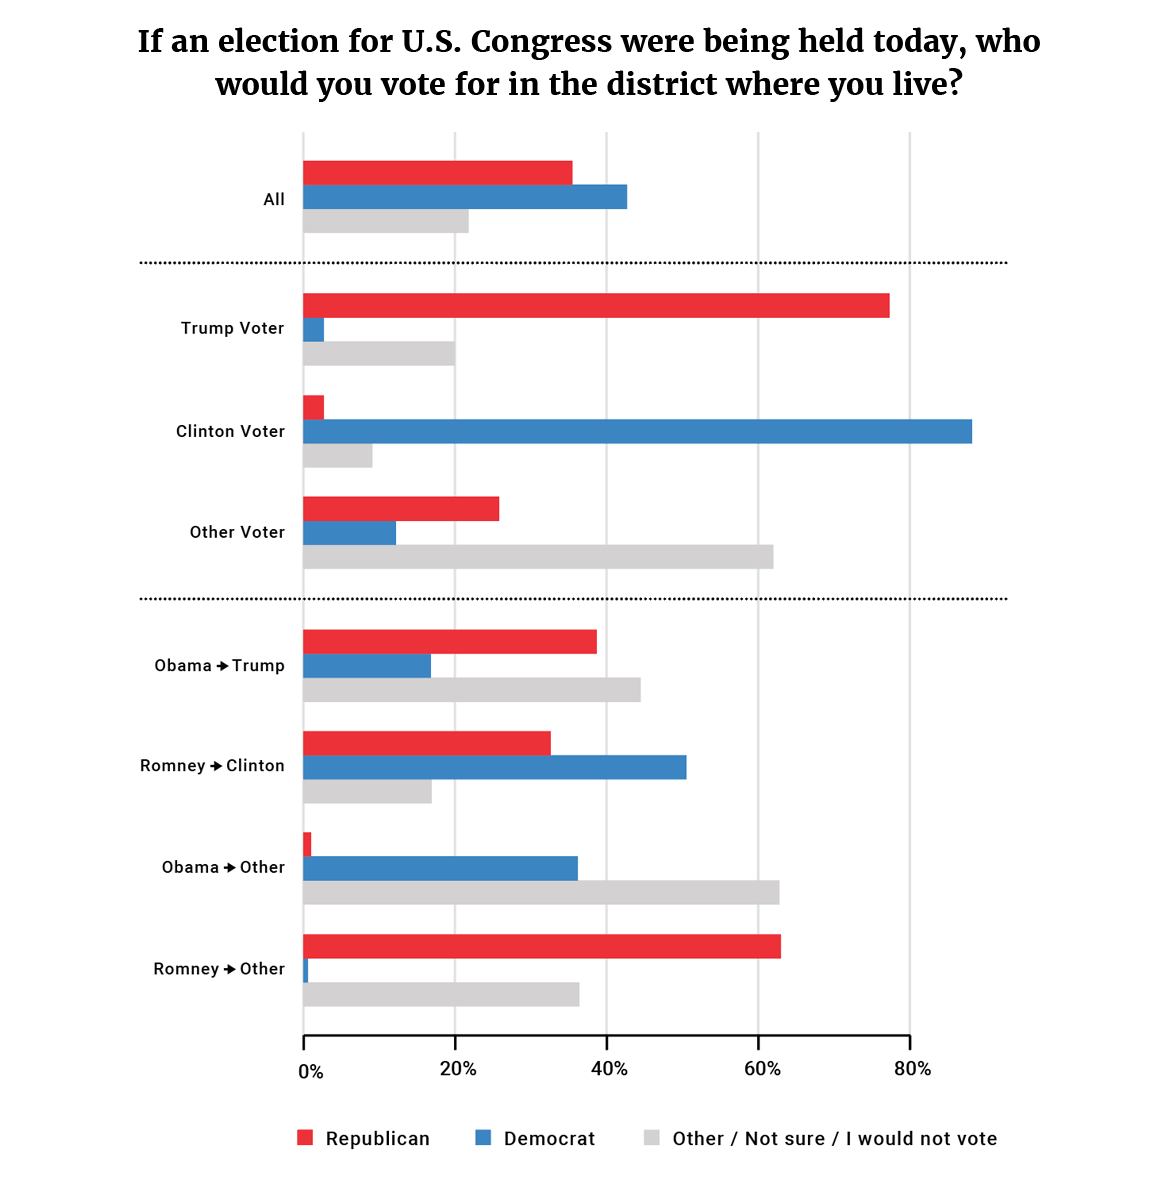
Democrats have an early edge in the 2018 midterms because of uncertainty among Trump voters.
While we must not over-interpret vote intention questions this far from the 2018 midterms, we can still glean insight into the current state of the electorate.
In line with other July polls, the Democratic Party has a 7-point lead over Republicans in the “generic ballot” question — 43 percent to 36 percent. This lead derives largely from uncertainty and defection among Trump voters, about 20 percent of who say that they will vote for a third-party candidate, are uncertain whom they will vote for, or will not vote. This is more than twice the number of Clinton voters reporting the same. Most third-party voters report uncertainty or intend to vote for a third-party candidate.
Among Obama-Trump voters, Republicans have a 22-point lead, but almost 45 percent of these voters did not indicate a preference for either major party. This contrasts with Romney-Clinton voters: Democrats have a similar 22-point lead among this group; only 17 percent did not indicate a preference.
Figure 3

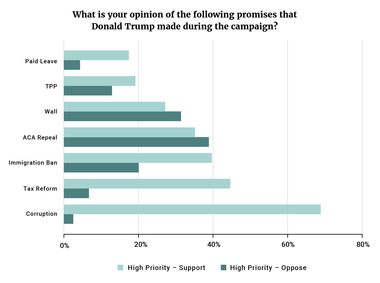
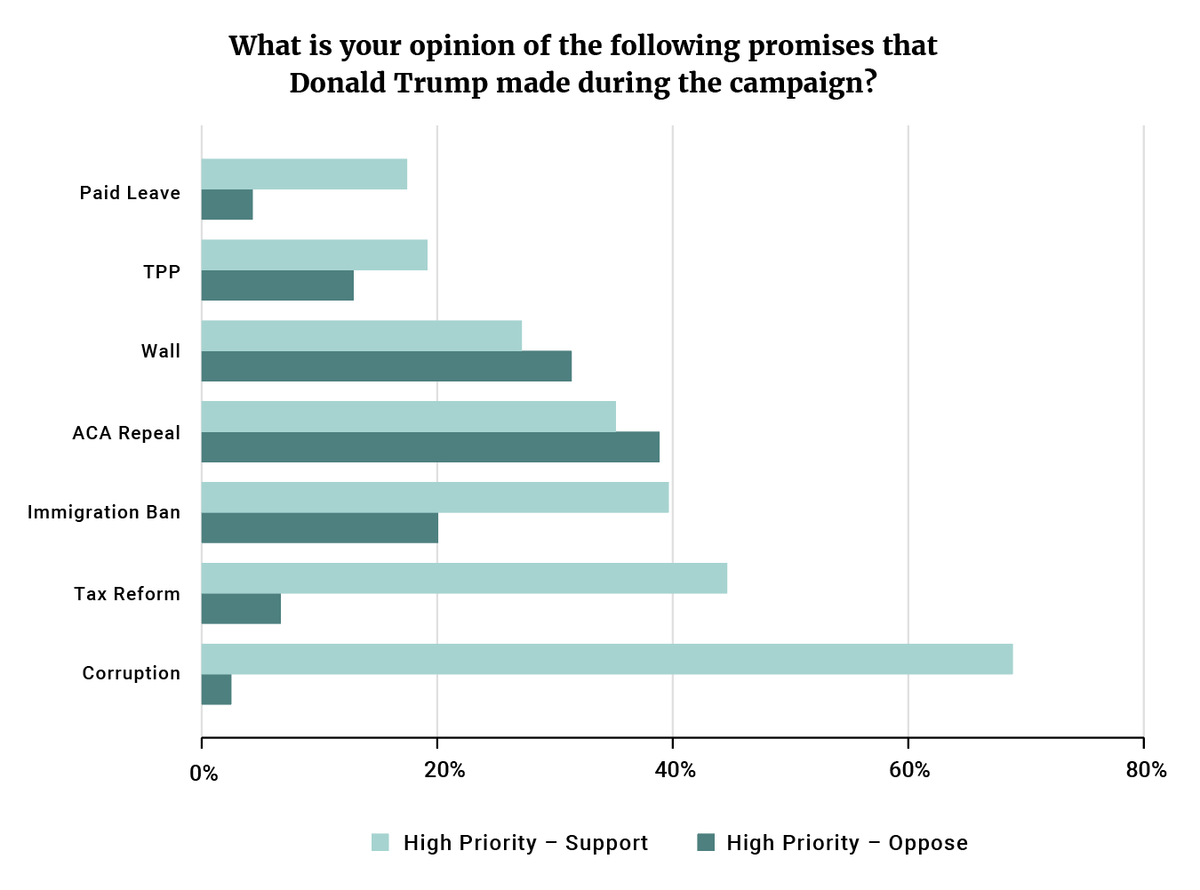
Strong opposition outweighs strong support on two of the President’s highest priorities.
The VOTER Survey asked respondents about a series of promises that Donald Trump made during the campaign. For each of the following proposals, we asked not only whether they supported or opposed it but also whether that was a high priority for them.
We define a “strong” position on the issue as expressing either support or opposition and also declaring that position a high priority.
Of these promises, there are only two where strong opposition outweighs strong support and they happen to be two of the President’s top priorities: ACA repeal and building the border wall. On every other issue, strong support is higher than opposition.
Figure 4
Despite a tumultuous six months, many other attitudes remain stable—with two exceptions.
Between the December and July surveys, there have been only minor shifts in the importance that respondents attach to different issues and in their feelings about important racial, religious, and social groups since our November survey. There are only two issues where opinion appears to have changed significantly.
First, there was a 13-point increase in the percentage of respondents who favored increasing trade with other nations. This increase was spread more or less equally among Democrats, Independents, and Republicans. This increase is striking because it runs counter to the rhetoric and policy of the Trump administration.
Second, support for a temporary Muslim immigration ban increased from 44 percent to 47 percent. Most of this increase was among Republicans (73 to 79 percent) and Independents (41 to 48 percent). The increase among Independents was mostly among those who self-identified as conservative. Thus, Trump’s push for a travel ban has coincided with increased support among voters predisposed to support the GOP or conservative policies.
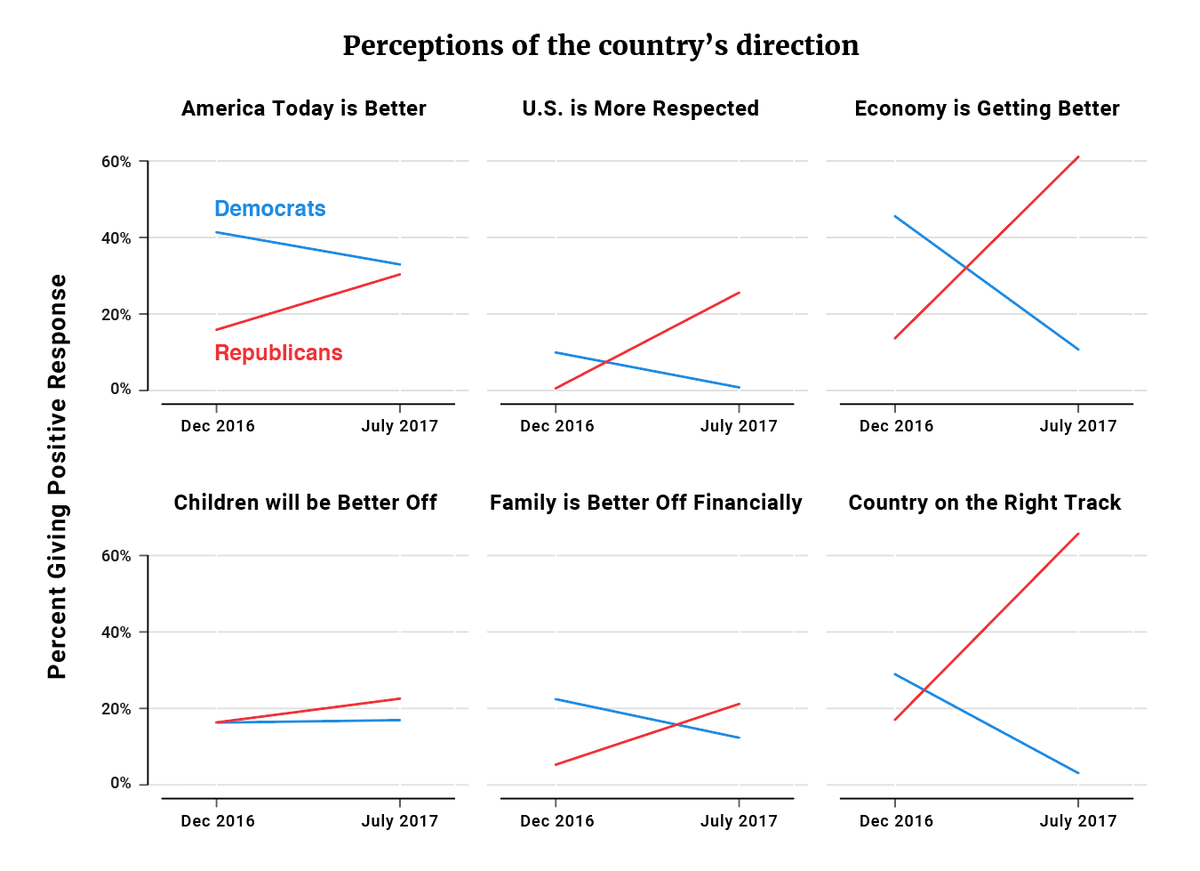
Americans’ views about the direction of the country and its prospects have shifted sharply along partisan lines.
In both the 2016 and 2017 VOTER Surveys we asked questions that tapped into Americans’ views of the economy and country — several of which also tap into key themes of the Trump campaign and presidency:
Figure 5
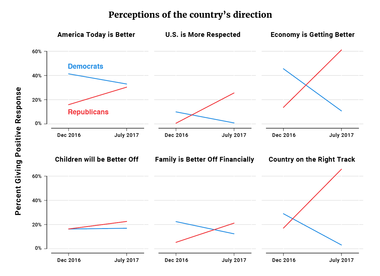
In line with political science research, partisanship strongly affected how Americans’ views have changed over the past seven months. Clinton voters generally felt worse about their quality of life as well as the nation’s economic and political standing. But Trump voters have become much more optimistic:
Americans generally have a negative opinion of Putin, but dislike the person they didn’t vote for even more.
Given Russia’s ongoing conflicts with the United States, including its interference in the 2016 election, it is no surprise that Americans have a negative view of Vladimir Putin. According to the VOTER Survey, 76 percent of respondents had an unfavorable view of Putin while just 12 percent had a favorable view.
Figure 6
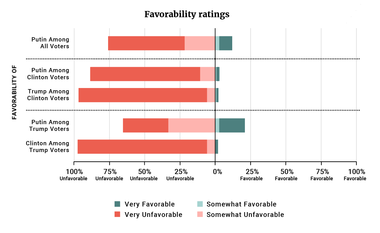
Views of Putin are tied to partisanship as well. Most Clinton voters have an overwhelming negative view of Putin. Although many Trump voters do too, there is a substantial minority — more than 20 percent — that has a favorable view of Putin. This is somewhat lower, however, than in another poll conducted immediately after the election — which found that 35 percent of Trump voters had a favorable view of Putin.(i)
Public attitudes toward Putin also illuminate our polarized times in this sense: Americans now dislike the opposing presidential candidate more than an authoritarian leader widely believed to have meddled in the 2016 election. Both Clinton and Trump voters dislike the candidate they didn’t vote for more than they do Putin. While 97 percent of Clinton voters view Trump unfavorably, just 88 percent view Putin unfavorably. For Trump voters, 97 percent view Clinton unfavorably and 65 percent view Putin unfavorably.


Subscribe to our mailing list for updates on new reports, survey data releases, and other upcoming events.


