
New Study Illuminates How Attitudes Toward Social Issues Helped Trump Win
The Democratic Strategist June 15, 2017

Key Findings
As we evaluate recent policy changes and look ahead to the 2018 midterm elections, asking questions about the views and values of the American electorate remains as important as ever. In December 2017, the Democracy Fund Voter Study Group published the report, “Placing Priority: How Issues Mattered More than Demographics in the 2016 Election,” which was based on data from the 2016 VOTER Survey (Views of the Electorate Research Survey). When evaluating the data, we used k-means cluster analysis to group the electorate based on how people prioritized issues on a Likert scale, as opposed to grouping the electorate by demographic attributes. This approach offered new ways to organize the electorate into groups of discernible voting behaviors.
In the 2016 VOTER Survey, respondents were asked how they would prioritize 23 issues — as either “very important,” “somewhat important,” “not very important,” or “unimportant.” Using that data, we identified five distinct voter groups or “clusters”: Democrat/Independent Liberal Elites (DILE), Democratic-Leaning Working Class (DLWC), Moderate Younger Middle-Income (MYMI), Conservative Younger (CY), and Conservative Older (CO). Each one of these groups, based on issue priorities and not on demographics, exhibited distinct political and ideological preferences. The underlying theory is that an individual’s issue priorities generate ideological and party preference and thus can provide a unique understanding of how the electorate considers issues in order to arrive at political decisions.
The Voter Study Group conducted a second survey in July 2017, contacting 5,000 of the original 8,000 respondents, and again asked them how they would prioritize the same 23 issues. When the cluster analysis was run again on this new dataset, remarkably similar groupings emerged, enough to demonstrate a level of continuity between the results of the cluster analysis for the 2016 data and the 2017 data. This similarity is the result we would expect, given that the two surveys make use of the same voter sample, if voters indeed take their issue priorities seriously and are unlikely to shift them dramatically in a short time.
This continuity strengthens the theory that meaningful and useful voter groups can be developed by looking at issue priorities.
This report demonstrates that the cluster analysis method can be repeated with a significant degree of consistency. It shows that there are coherent ways to organize the electorate in order to predict ideological and party preference beyond demographic attributes, like race or gender. It follows that issue prioritization cluster analysis can help broaden the scope of our research and enrich our understanding of voter behavior by providing a novel framework for analytically navigating a diverse American electorate.
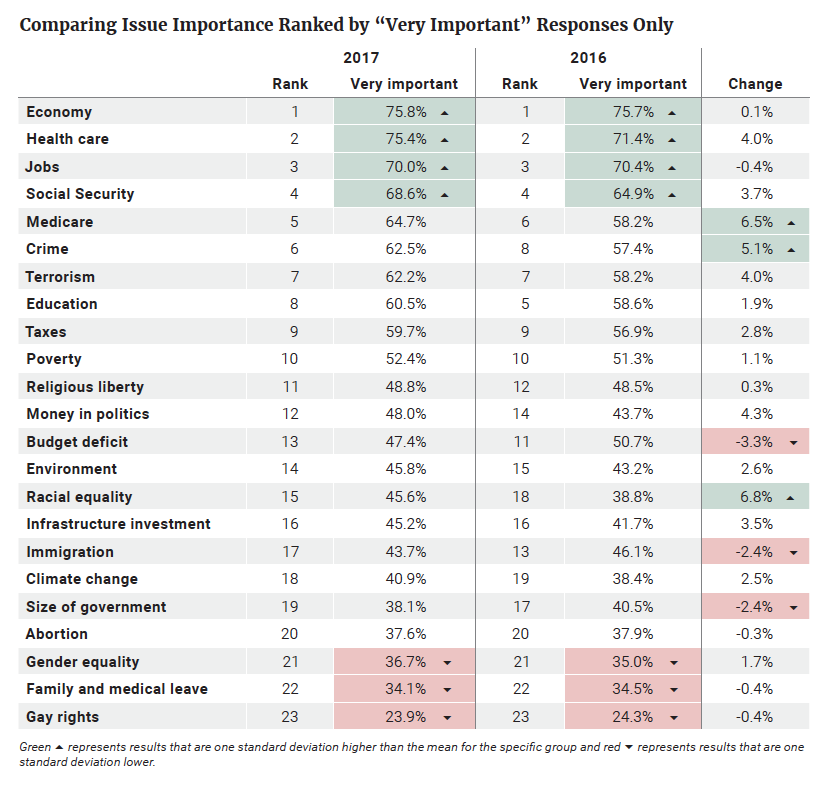
In the 2017 VOTER Survey, respondents were asked for a second time to prioritize 23 issues as “very important,” “somewhat important,” “not very important,” or “unimportant.” The economy remained the issue that was most important to the most voters, with 99 percent of the electorate listing it as either “very” or “somewhat important.” Of the 23 issues tested, eight were identified as “very” or “somewhat important” by 90 percent or more of the electorate, and three were identified as such by 95 percent or more. Those three issues were (as they were in 2016) the economy, health care, and jobs — although in 2016, jobs came in ahead of health care. The remaining issues above 90 percent in the 2017 VOTER Survey were Social Security, crime, taxes, education, and Medicare. At the other end of the spectrum were four issues that less than 70 percent of the electorate listed as either “very” or “somewhat important”: abortion, gender equality, climate change, and gay rights. These four issues were also not a change from 2016.
On average, an individual respondent listed about 19 issues as “very important” or “somewhat important,” compared to 18 issues in 2016. Forty-six percent of the respondents said 20 issues or more were “very important” or “somewhat important” in 2017, similar to the 45 percent who did so in 2016. However, when prioritization is limited to “very important,” the average respondent identified only about 12 issues out of 23 in this way. Six percent of 2017 respondents said 20 issues or more were “very important.” These percentages are similar to those in the larger respondent pool in 2016, which on average identified 11 issues as “very important,” with about 8 percent saying 20 or more of these issues were “very important.” As in the previous survey, these numbers suggest the “very important” responses likely reflect the key issues an individual would consider in deciding how to vote. With a 12-issue average, even the “very important” category probably contains more responses than an individual voter would have put on a personal priority list, but it is reasonable to use for that purpose.
In looking at issues viewed specifically as “very important,” the economy (76 percent), health care (75 percent), and jobs (70 percent) maintain their standing in the top tier of issues. At the other end of the list, the issues seen as “very important” by less than 40 percent of the electorate included the size of government, abortion, gender equality, family and medical leave, and gay rights. There was a slight change from 2016: on that survey, the size of government was seen as “very important” by about 40 percent of the electorate, while climate change had a spot on the under 40 percent list.
Throughout this report (starting with Table 1), significant differences in how voters defined the importance of these issues relative to the importance they placed on other issues are color-coded in order to standardize differences across groups. Green represents issues chosen by a percentage of a group of voters that were one standard deviation higher than the mean for issues for that specific group of voters, and red represents results that are one standard deviation lower. For example, 76 percent of voters in 2017 said the economy was a “very important” issue — a percentage at least one standard deviation above the mean percentage of “very important” for all the other issues, so this statistic appears in green (Table 1).
When using this methodology, cases that are within one standard deviation tend to represent about 68 percent of the total, while those at either end of the spectrum beyond one standard deviation represent about 16 percent each, giving a reasonable reflection of prioritization for our purposes. An issue listed as one deviation lower than the mean (in red) does not mean voters (or a voter group) thought it was not important, but rather that in comparison to other issues it was less of a priority.
Table 1
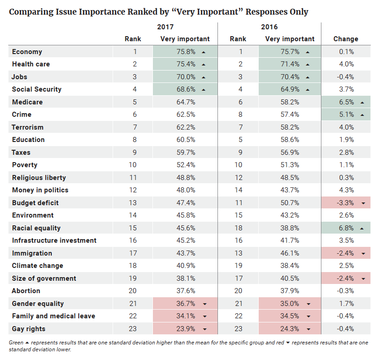
The same set of issues ranked one standard deviation above average in terms of priority in both 2016 and 2017 — the economy, health care, jobs, and Social Security. Similarly, the same set of issues ranked one standard deviation below average — gay rights, family and medical leave, and gender equality (Table 1).
While these top and bottom tier priorities did not change, some movement among the issues in the center of the chart was within one standard deviation of average priority. We looked at the change from 2016 to 2017 in the percentage of voters who identified each issue as “very important” to determine which issues changed to the greatest extent. The mean percentage change among all issues was +1.8 percent; consistent with our color-coding system (Table 1), a green shade in the “Change” column indicates that the change in percentage was an increase greater than one standard deviation above that mean, and red indicates that the change was a decrease greater than one standard deviation below that mean. The issues that increased in importance by more than a standard deviation were racial equality, Medicare, and crime. Those that decreased by more than a standard deviation were the budget deficit, immigration, and the size of government.
When we initially conducted this study with the data for 2016, we examined issue priorities by a variety of demographic variables. What was noteworthy was that, despite differences in issue priorities among different demographic groups, there was general broad agreement on the higher priority issues and, to a lesser degree, those issues on which voters placed less of a priority. The most striking differences were apparent when looking at party and ideology, rather than demographics such as gender, age, race, income, and education. The same was true for the 2017 VOTER Survey data. An important distinction here is that party and ideology are choices as opposed to attributes of an individual, such as gender and race. Learning that demographics might get us only so far in ascertaining the issues that factor into voters’ decision-making processes, we flipped the model to look at the electorate as defined by issue priorities, rather than demographic variables. The results of our first analysis suggested that the mix of issue priorities could yield valuable insights, and in many cases, a more comprehensive voter profile than demography alone. After repeating the procedure used with 2016 data with new data from 2017 we stand by our initial conclusion.
Using the 2016 VOTER Survey data, we ran a k-means cluster analysis of responses to Likert scale questions on the 23 issues. We ran the analysis several times with expanded or reduced numbers of categories, within the confines of a reasonable iteration process, revealing a number of possible options. The next step was to run analysis of variance (ANOVA) tests to define whether any of the options provided clear statistical differences between clusters. In this case, the result that produced five clusters best achieved this. As in any cluster analysis, more or fewer clusters could be developed. We repeated this procedure with the 2017 VOTER Survey data, and again found that five clusters provide a valuable and clear way of understanding some of the major divisions among the electorate in terms of issue priorities.
Clusters were created each time on the basis of issue priorities — how voters ranked the issues (“very important,” “somewhat important,” “not very important,” and “unimportant”). Cluster boundaries were erected around existing patterns we have detected in the electorate based on what issues voters say they prioritize. It turns out, perhaps unsurprisingly, that voters tend to “cluster” around specific preferences, and that these clusters are fairly coherent across time when we control for the same sample.
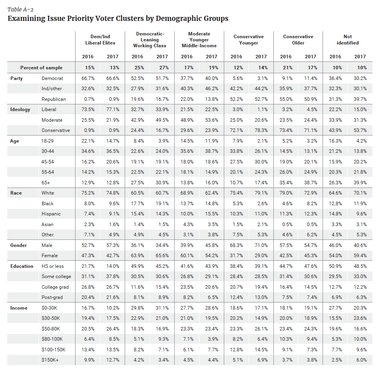
Clusters were named according to characteristics we observed about each. In keeping with the previous analysis, we termed these five clusters the Democrat/Independent Liberal Elites voters (DILEs) (13 percent of the electorate), the Democratic-Leaning Working Class voters (DLWCs) (27 percent), the Moderate Younger Middle-Income voters (MYMIs) (19 percent), the Conservative Younger voters (CYs) (14 percent), and the Conservative Older voters (COs) (17 percent), with an additional 10 percent unidentified by these clusters. This latter group was unidentified because they did not respond to all 23 issue questions in the survey.(1) Overall, these five cluster names generally reflect the party affiliation or ideological preference of their voter makeup. For example, in 2017, 99 percent of DILEs identified as either Democrats or independents and 77 percent of this group identified as “liberal.” These five clusters were not premeditated or purposefully designed to fit specific ideological categories, even if their labels suggest otherwise. For example, there may be some Republicans in the DLWC cluster, but they fall into this cluster based on an issue mix that separates them from other Republicans.
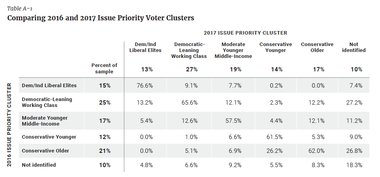
These cluster groups were given the same names as they have in the previous “Placing Priority” report because of the striking similarity they bear to the 2016 clusters in both demographic data and actual membership, which allows for interesting analysis in comparing the two. We compare the two cluster groups directly (Appendix Table A-1), demonstrating the percentage of voters in each cluster who moved from one cluster to another between 2016 and 2017. We also present a more detailed demographic breakdown of the clusters for 2017, including party affiliation (Appendix Table A-2). Overall, about 70 percent of respondents grouped together in a similar cluster the next year.(2) The cluster with the greatest year-over-year movement (other than the small percentage of those “not identified” with any one cluster) was MYMIs, 58 percent of whom stayed in that cluster from 2016 to 2017, with the rest spreading between COs and DLWCs. Every other group retained upwards of 60 percent of its membership, with DILEs maintaining 77 percent between 2016 and 2017. This level of coherence between the two tests was significant enough to justify retaining the cluster names for easier comparison and analysis.
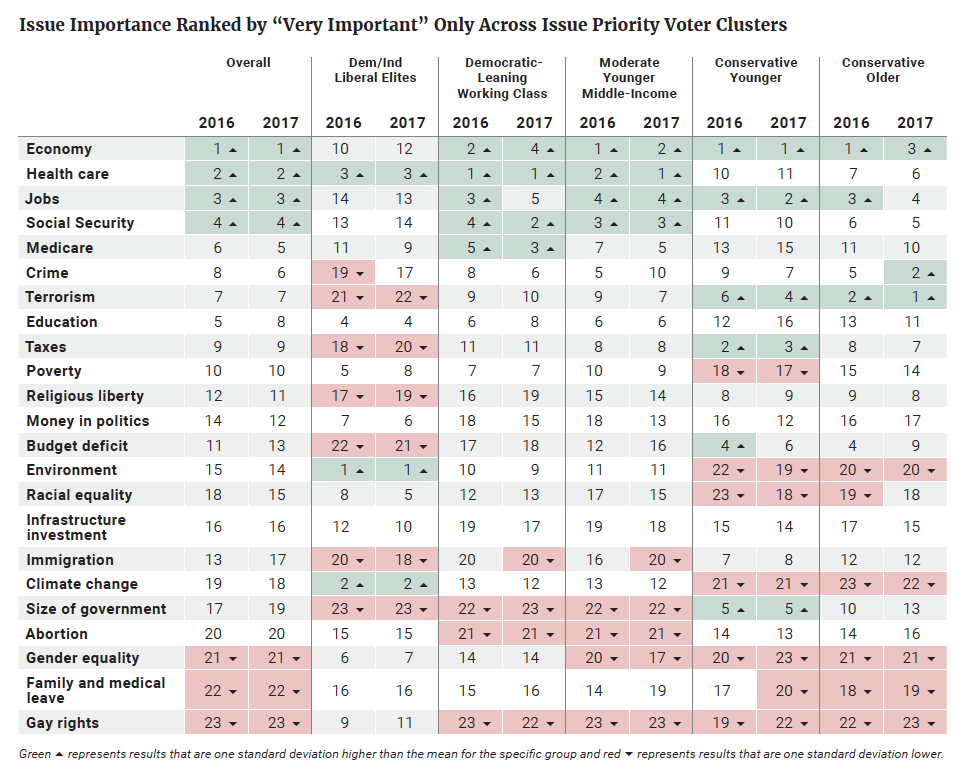
Issue priorities are identified for each cluster, ranked from first to last (Table 2). To create a ranking, we calculated the percentage of voters in each cluster who said an issue was “very important.” The ranking columns are based on that percentage from highest to lowest.
(1) Demographically, this unidentified group looks like a cross-section of the overall electorate, which means we are not “missing” any key group of voters in our analysis by leaving them out.
(2) To better understand the movement of approximately 30 percent of respondents to a different cluster, we calculated the mean of the Euclidean distances between each respondent and that respondent’s cluster center. Respondents who switched clusters from 2016 to 2017 had a mean Euclidean distance of 3.15, while those who stayed in the same cluster had a mean distance of 2.95. Thus, respondents who switched membership were those who were more likely to appear on the margin or “fringe” of each cluster.
Table 2

As observed in our previous analysis in 2016, there was some agreement about the most important issues facing the country. The two conservative groups and the moderate group each placed the economy within their top three issues, and the DLWC placed it fourth. Each of these clusters also placed jobs within their top five issue priorities. The exception was the DILEs, for whom the economy and jobs were 12th and 13th respectively. In contrast, DILEs again prioritized the environment, climate change, and health care. With the exception of health care, these issues were seen as a much lower priority among the other groups.
DILEs again differed from the other groups and the overall electorate in terms of the issues on which they placed less emphasis. Terrorism, taxes, religious liberty, and the budget deficit were all bottom-tier issues for DILEs, but fell within the middle or at the top end of the spectrum for the rest of the groups.
CYs stood out for their prioritization of size of government and taxes, and the lack of priority they place on racial equality and poverty. They shared with COs a prioritizationof terrorism, and a lack of priority placed on the environment and climate change. COs also prioritized crime. The MYMIs and the DLWCs looked similar to the overall electorate, with less prioritization of immigration and abortion. They shared with the DILEs a lack of prioritization of size of government.
Only one of the top five issues for the overall electorate was a top-five issue for DILEs: health care. In contrast, the DLWCs and MYMIs had all five top priorities in common with (but not in the same order as) the overall electorate. The CYs had two of the five (economy and jobs) and the COs had three of the five (economy, jobs, and Social Security).
A comparison between the relative issue rankings among each of the clusters for 2016 and 2017 shows that there was little change in terms of issue prioritization among each of the clusters from 2016 to 2017. There were, however, a few smaller differences. For example, DLWCs saw Social Security and Medicare as top-three issues along with health care in 2017, while in 2016 their top three priorities were health care, the economy, and jobs. Crime was also a more important issue for COs in 2017 than 2016. Immigration dropped into the bottom tier of issue priorities for both the DLWCs and the MYMIs, while the deficit dropped into the middle tier for CYs. Crime also rose slightly, into the middle tier, for DILEs.
In repeating the cluster analysis method with 2017 VOTER Survey data, the underlying theory of the initial study — that issue priorities can group voters in meaningful ways beyond demographics — held true. Indeed, the clusters themselves were remarkably stable year over year, suggesting that these groupings of issue priorities are a valuable way to organize the electorate for analytical purposes.
Issue prioritization cluster analysis offers several useful avenues for further research this election cycle. For one, this process can be used to map voting preferences onto issue prioritization. We can test how these clusters stack up by voting intention and determine the structure of issue importance relative to the 2016 election, the generic ballot, and even President Donald Trump’s approval rating. These analyses would help us to understand the specific issues that animate voting behavior and how voters respond to different issue packages presented by candidates. Thus we can assess, with considerable accuracy, the degree to which candidates capture specific voter groups by way of issue prioritization.
Moreover, in future studies with the VOTER Survey dataset, this process can be replicated to investigate more narrow policy questions — such as reactions to the Tax Cuts and Jobs Act — by issue cluster. This research could provide valuable insights on the specific preferences underlying issue importance. If our clusters agree on the importance of certain issues through their prioritization of them, do they also agree on solutions?

Subscribe to our mailing list for updates on new reports, survey data releases, and other upcoming events.


