
Polls show little evidence of difficulty voting in 2020 elections
The Hill June 9, 2021
Elections, Political Parties, Race & Ethnicity
Key Findings
Throughout the 2020 presidential campaign, election experts raised a series of concerns about possible problems voters could face in November. Headlines suggested that the November election would be “a mess” and worse, that there could be a 2020 “election meltdown.” Concerns about COVID-19 loomed large in Americans’ thoughts as they contemplated whether or how they would vote. A possible shortage of poll workers due to the pandemic added to concerns. Foreign interference did not worry American voters as much in 2020 as it had in 2016 and 2018, but experts were still concerned about serious mischief and worse from outside adversaries. There were new questions about whether the U.S. Postal Service would be able to mail and collect ballots on time. Then there were the doubts sown by President Trump himself with his relentless attacks on voting by mail. Spotty performance in the primaries in some key states only added to press coverage of possible “nightmare” scenarios.
It is hardly surprising that doubts about voting seeped into public consciousness. Registered voters split evenly in a July–August 2020 Pew Research Center survey about whether voting would be easy (50 percent) or difficult (49 percent). In Pew’s late September–early October 2018 survey, only 15 percent of registered voters thought it would be difficult. In the Center’s September–October 2020 survey, more said voting would be easy (65 percent), but 35 percent still thought it would be hard. Yet, defying expectations of many in the press, some pundits, and even a considerable slice of the public itself, 94 percent of voters participating in the 2020 Pew post-election survey said voting in the election had been very (77 percent) or somewhat (17 percent) easy for them personally.
The VOTER Survey (Views of the Electorate Research Survey) conducted online from November 13 to December 7, 2020 augments the Pew survey in important ways. This Democracy Fund Voter Study Group survey looks at a variety of specific impediments voters encountered and finds little evidence they were widespread. The results were surprisingly uniform across racial and ethnic groups, and they echo the findings of three earlier national surveys. These include a 2018 survey by the Public Religion Research Institute (PRRI) and The Atlantic, an NPR/Marist Poll in 2018, and an NPR/PBS NewsHour/Marist Poll in 2020. The overall ease of voting and the relative dearth of impediments for the vast majority of voters are impressive given the changes in how Americans actually voted in 2020.
The United States has undergone a revolution in voting over the past 40 years. In 1980, only four million ballots were cast before Election Day. Over the next four decades, absentee and mail-in voting became more popular alternatives to voting in person. Election experts in the 1980s expressed a variety of concerns. For example, would voting absentee encourage fraud? Would vote security be affected by early or absentee voting? Would those who voted early miss out on important debates? And would the new methods erode a valuable civic ritual? Today, most experts do not see these concerns as major ones, and the public’s preference for convenience voting has grown. In 2020, over 100 million ballots were cast before Election Day, with around 65 million coming from mail-in ballots.
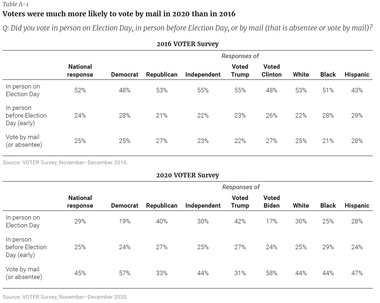
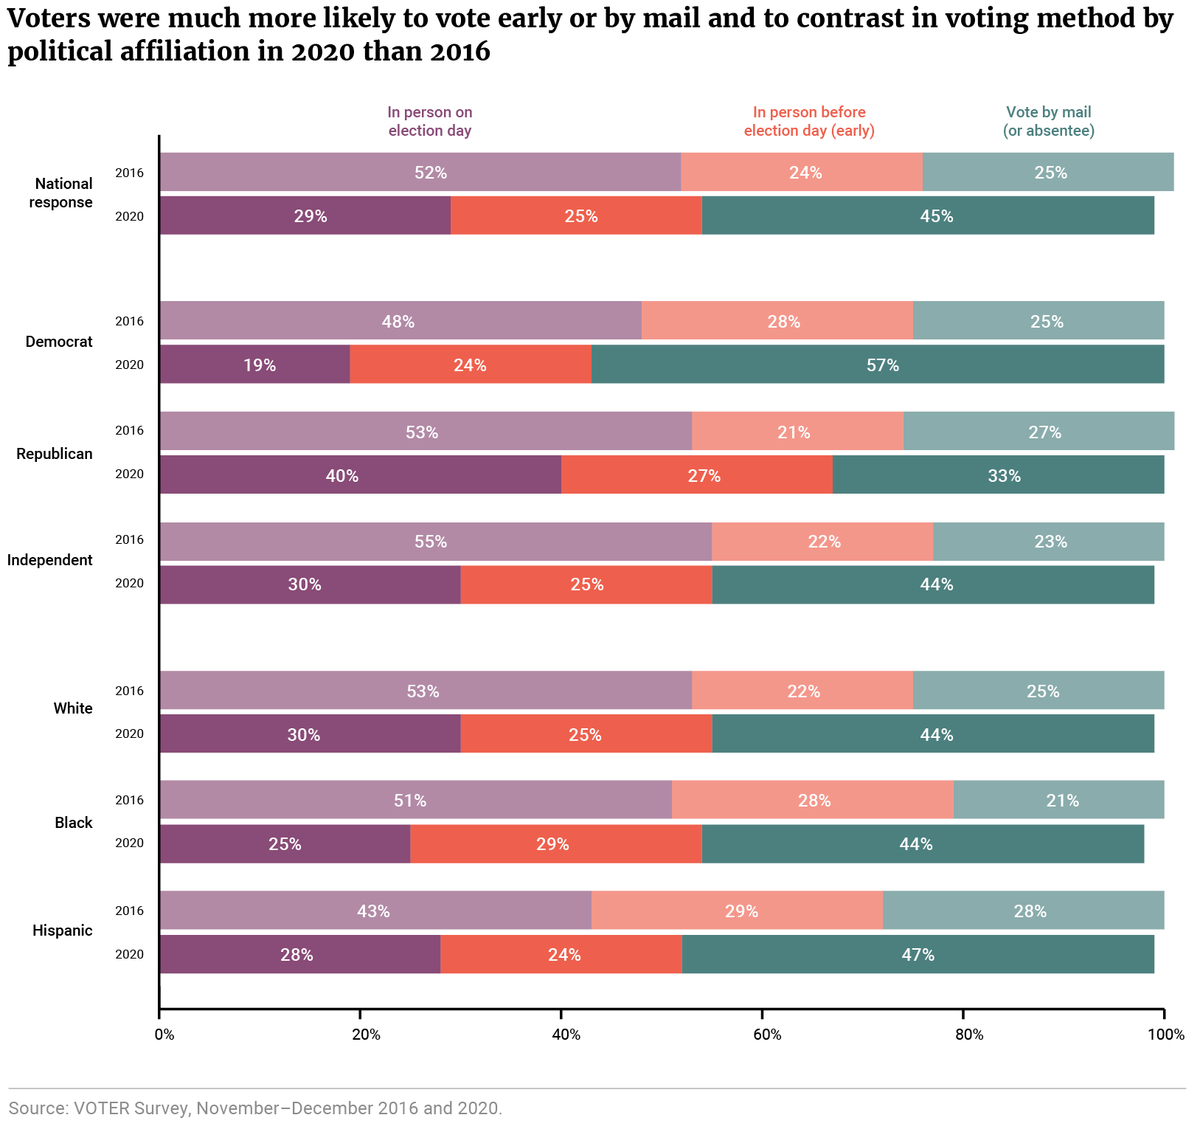
All told, the changes in voter behavior since 2016 are remarkable. The Voter Study Group used identical language in its 2016 VOTER Survey in a question about voting methods. Comparing the results shows that far more people voted in person in 2016 (52 percent) than did so in 2020 (29 percent). Voting by mail was less popular overall in 2016 (25 percent) than in 2020 (45 percent). Similar shares voted in person early in both years (Figure 1).
Similar shares of Democrats and Republicans voted by mail in 2016 (25 and 27 percent, respectively). However, these numbers diverged in 2020 with 57 percent of Democrats voting by mail, compared to a third of Republicans. In 2016, more Republicans opted to vote in person on Election Day (53 percent) than did so in 2020 (40 percent). More than twice as many Democrats voted in person in 2016 (48 percent) than in 2020 (19 percent). Twenty-eight percent of Democrats, 21 percent of Republicans, and 22 percent of independents voted in person before Election Day in 2016. These numbers mirrored those of 2020 when 24 percent of Democrats, 27 percent of Republicans, and 25 percent of independents voted in person early.
Clinton voters in 2016 were slightly more likely to vote by mail than Trump voters that year (27 and 22 percent, respectively). But in 2020, Biden voters were almost twice as likely to vote by mail (58 percent) than were Trump voters (31 percent). In 2016, 28 percent of Hispanic, 25 percent of white, and 21 percent of Black voters voted by mail. In 2020, however, strong pluralities of each group voted by mail (Table A-1). (It should be noted that the VOTER Survey was conducted only in English.)
Figure 1

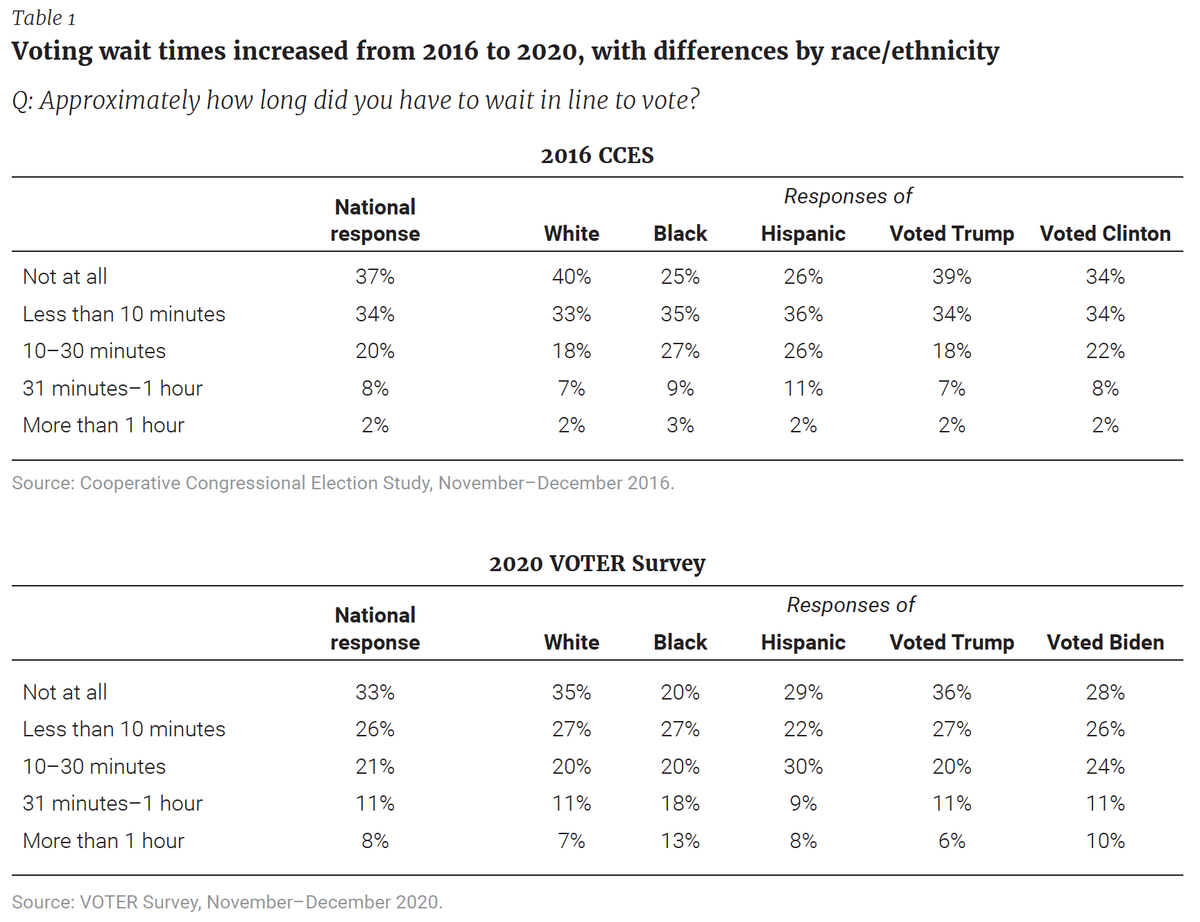
Of voters nationally who voted in person in 2020, a solid majority (59 percent) reported waiting less than 10 minutes or not at all. Sixty-two percent of white, 47 percent of Black, and 51 percent of Hispanic voters gave these responses. Roughly two in 10 nationally (21 percent) said they waited between 10 minutes and half an hour, 11 percent waited 31 minutes to an hour, and 8 percent waited more than an hour. Almost twice as many Black (31 percent) as white (18 percent) or Hispanic voters (17 percent) reported waiting 31 minutes or more. Roughly equal shares of Biden voters (21 percent) and Trump voters (17 percent) reported having to wait this long (Table 1).
Voters did spend more time waiting in line to vote in 2020 than they did in 2016. Nearly twice as many voters spent 31 minutes or more waiting in line in 2020 (19 percent) than in 2016 (10 percent). The 2016 Cooperative Congressional Election Study survey that asked the identical question shows that 9 percent of white, 12 percent of Black, and 13 percent of Hispanic voters reported waiting at least 31 minutes to vote. At the lower end of wait times, 71 percent of voters in 2016 reported waiting less than 10 minutes or not at all. Seventy-three percent of white, 60 percent of Black, and 62 percent of Hispanic voters gave this response. A similar 20 percent of voters in 2016 waited 10 to 30 minutes. Voters who voted for Hillary Clinton in 2016 and those who chose Trump in that election reported similar wait times.
Table 1

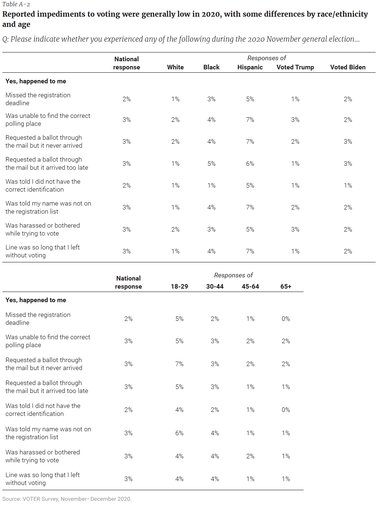
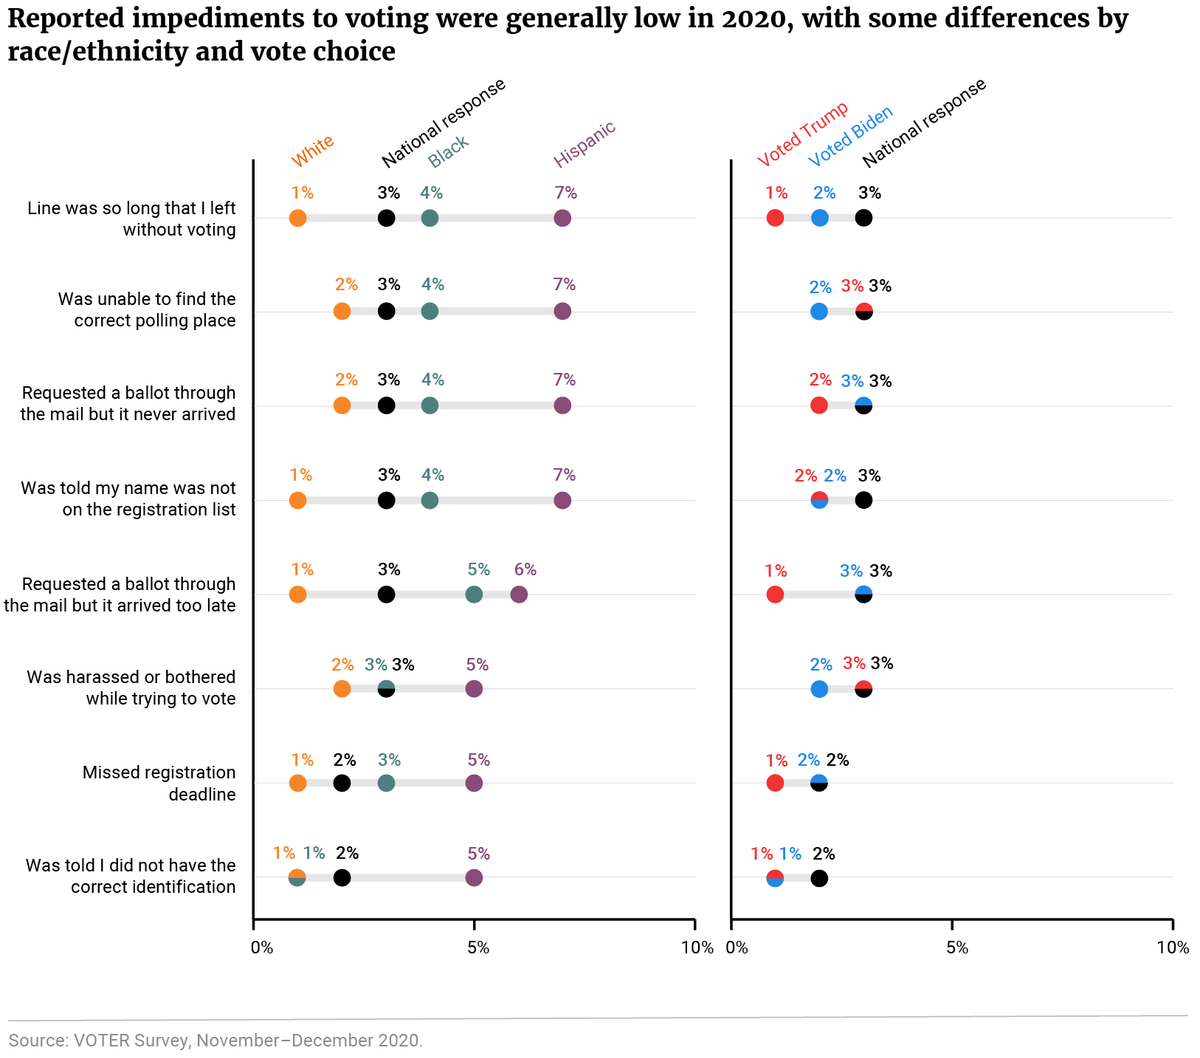
There are other ways that voting procedures can be onerous besides wait times. The 2020 VOTER Survey explored a series of impediments that people might have faced as they attempted to cast their ballots. Out of eight possible impediments to voting, none were experienced by more than 3 percent of Americans nationally. Still, 3 percent is not an insignificant number.
Three percent nationally said they had been unable to find the correct polling place, and 2 percent indicated they missed the registration deadline. Among Hispanics, 7 percent could not find the correct polling place, and 5 percent missed the registration deadline. The VOTER survey asked separate questions about mail-in ballots that never arrived or arrived too late to be counted. In both cases, 3 percent nationally said this had happened to them. Seven percent of Hispanics said they never received the mail-in ballot they requested, and 6 percent said it had arrived too late. Five percent of Black people, compared to 1 percent of white people, said the absentee ballot they had requested arrived too late (Figure 2).
Once at the polling places, small numbers of people experienced problems. Three percent nationally indicated the lines were too long, and that they simply gave up; 7 percent of Hispanics, 4 percent of Black people, and 1 percent of white people said this happened to them. Three percent said they were told their name was not on the registration list, including 7 percent of Hispanics, 4 percent of Black people, and 1 percent of white people. Three percent nationally said they had been harassed or bothered while trying to vote; again, Hispanics were more likely to report this (5 percent) than Black (3 percent) or white (2 percent) people. Finally, 2 percent were told they didn’t have the correct identification; once again, Hispanics were more likely to give this response (5 percent) than Black or white people (1 percent each).
For almost every impediment, those in the youngest age group surveyed were slightly more likely than those in the older age groups to indicate they had had a problem voting, but the differences were small. For just two of the impediments — being harassed or bothered while trying to vote and giving up because of long lines — 18- to 29-year-olds and 30- to 44-year-olds gave identical low responses (4 percent). There were no significant differences between Trump and Biden voters on any impediment (Table A-2).
Figure 2

At least three other surveys conducted by major pollsters have explored voting impediments in recent years. A survey by the Public Religion Research Institute (PRRI) and The Atlantic conducted in June 2018 asked respondents whether they had experienced a series of difficulties the last time they tried to vote. In this survey as in the 2020 VOTER Survey, the percentages of Americans who experienced these difficulties were not large. Four percent said they couldn’t get off work to vote, 3 percent were unable to find the correct polling place, 2 percent missed the registration deadline, 3 percent were told that their name was not on the registration list, 2 percent said they were harassed or bothered while trying to vote, and less than 1 percent did not have the correct identification. In every case, Hispanics and Black people were more likely to have experienced the problem than white people, though in most cases, the numbers were small. Nine percent of Black people, however — the highest level recorded by a racial subgroup — said they were told their name was not on the list even though they were registered.
The NPR/Marist Poll from September 2018 asked Americans about whether a series of issues had affected them “a lot,” “sometimes,” “hardly ever,” or “never.” Four percent said having their voter registration questioned or being told they were not registered to vote had happened to them a lot or sometimes, while 5 percent said the same about having a hard time getting to their polling place. Six percent said having broken voting machines or not enough ballots at their polling place happened a lot or sometimes, and 11 percent said the same about not getting time off from work to vote. Twenty percent said having to wait in long lines at their polling place had happened to them a lot or sometimes.
In January 2020, the NPR/PBS NewsHour/Marist Poll also asked about problems at the polls. The questions were similar to those used in the survey conducted by NPR and Marist in 2018. Thirty-one percent in the January 2020 poll said that having to wait in long lines at their polling place had been a problem a lot or sometimes. Those who described other problems as happening a lot or sometimes included 15 percent who reported being confused about how to fill out their ballot, 15 percent who described not getting time off from work to vote, 10 percent who had a hard time getting to their polling place, 6 percent who had problems with their registration or identification, and 5 percent who reported having broken voting machines at their polling place. Fewer than 10 percent said any of these things had happened a lot.
The evidence from the new VOTER Survey and the work of these other pollsters would seem to suggest that for most Americans, impediments to voting are not widespread. Despite the pandemic and Americans’ anticipation of other potential voting problems, the election in 2020 actually went about as smoothly as the previous election. In Pew’s 2018 post-election survey, 76 percent of voters said it had been very easy to vote in the midterm election that year, and an additional 16 percent said it had been somewhat easy, a response that is virtually identical to Pew’s 2020 post-election results cited above (77 percent and 17 percent, respectively). In 2018, 7 percent of voters said it was somewhat difficult and 1 percent said it was very difficult to vote in the midterm. Again, these numbers mirror Pew’s 2020 findings (5 percent said somewhat difficult; 1 percent said very difficult).
In the run-up to the election, most state election officials voiced confidence that their state would be able to handle the early and Election Day vote. Many states implemented policies to encourage convenience voting. Some eased rules on who could become a poll worker and increased poll worker pay. Funding from the federal CARES Act, in addition to private grants distributed through the Center for Technology and Civic Life and the Center for Election Innovation and Research, helped states handle the extra mail ballots and provide personal protective equipment for their elections staff.
While most voters haven’t experienced major impediments to voting, voters are expressing more concern than in the past about whether their vote was counted accurately. There are stark partisan divisions on that question today.
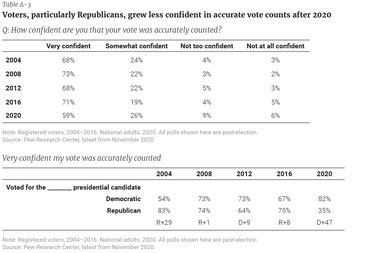
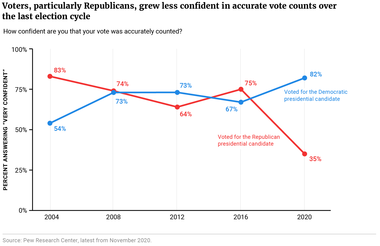
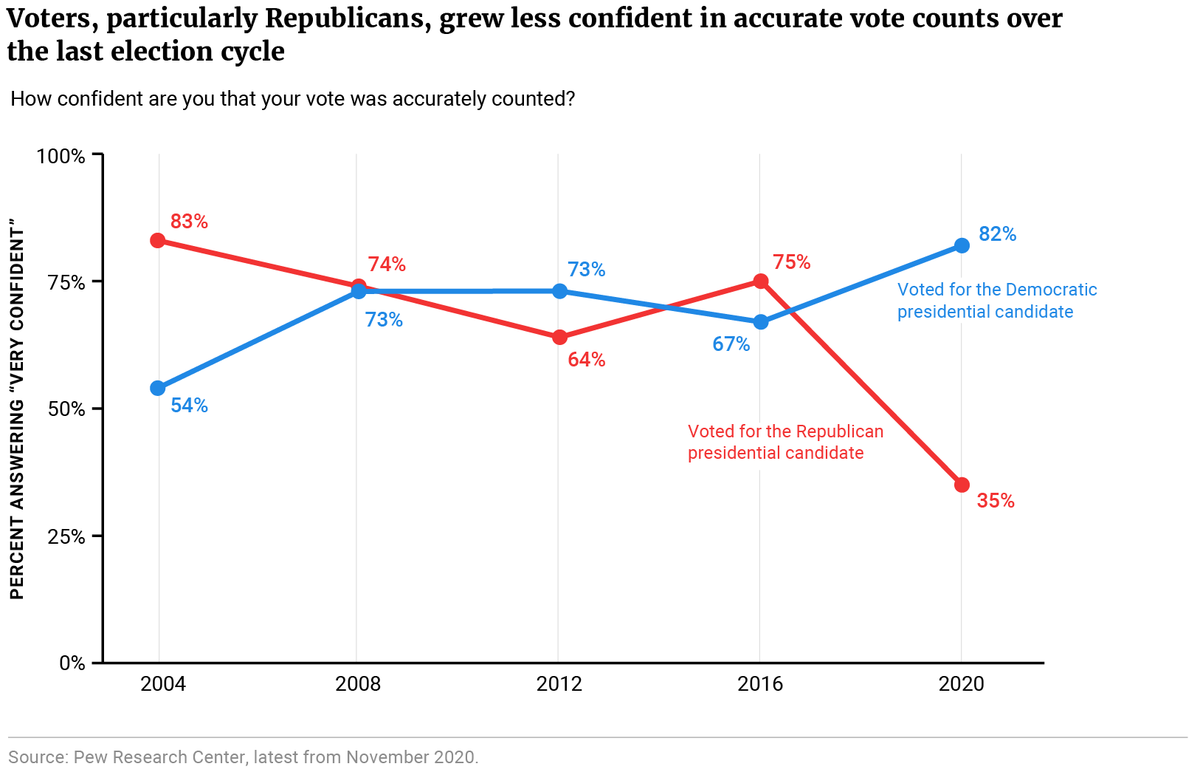
After each presidential election from 2004 to 2020, the Pew Research Center asked people about how confident they were that their vote was “accurately counted.” Between 2004 and 2016, no fewer than 90 percent of self-identified voters in these post-election surveys said they were very or somewhat confident about this. Overall confidence dropped to 85 percent in 2020, with an especially steep drop in the proportion saying they were very confident their vote was accurately counted. The VOTER Survey shows 73 percent were very or somewhat confident that their vote was accurately counted. In both the Pew and VOTER Survey post-election polls, Democrats were much more confident about this than Republicans. A third of Republicans responding to the VOTER Survey were not confident at all that their vote had been accurately counted. Only 3 percent of Democrats said the same.
However, before the election and the pandemic, Democrats were actually less confident than Republicans that the results of the 2020 election would be accurate. In the NPR/PBS NewsHour/Marist Poll from January 2020 — 10 months before the election — 60 percent of Democrats, 83 percent of Republicans, and 74 percent of independents expressed a great deal or a good amount of trust that the results of the 2020 election would be accurate. A year later in this group’s January 2021 poll, 92 percent of Democrats said they trusted that the results of the 2020 election were accurate, compared to only 20 percent of Republicans and 56 percent of independents.
Figure 3
In the 2004 election that resulted in a second term for George W. Bush, Americans who voted for him expressed much higher confidence that their vote had been accurately counted than those who voted for John Kerry. In 2008, there were no such differences between Barack Obama and John McCain voters. In 2012, Obama voters had higher confidence in accurate counts than Mitt Romney voters, and in 2016, Trump voters were more highly confident than Hillary Clinton supporters about accurate counts. Voters whose preferred candidate wins usually express higher confidence, which is evident in the data, except for 2008 (Figure 3, Table A-3).
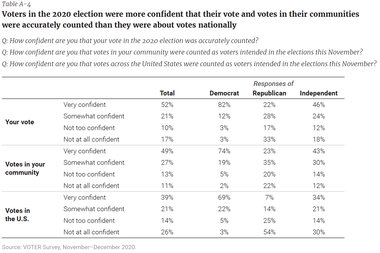
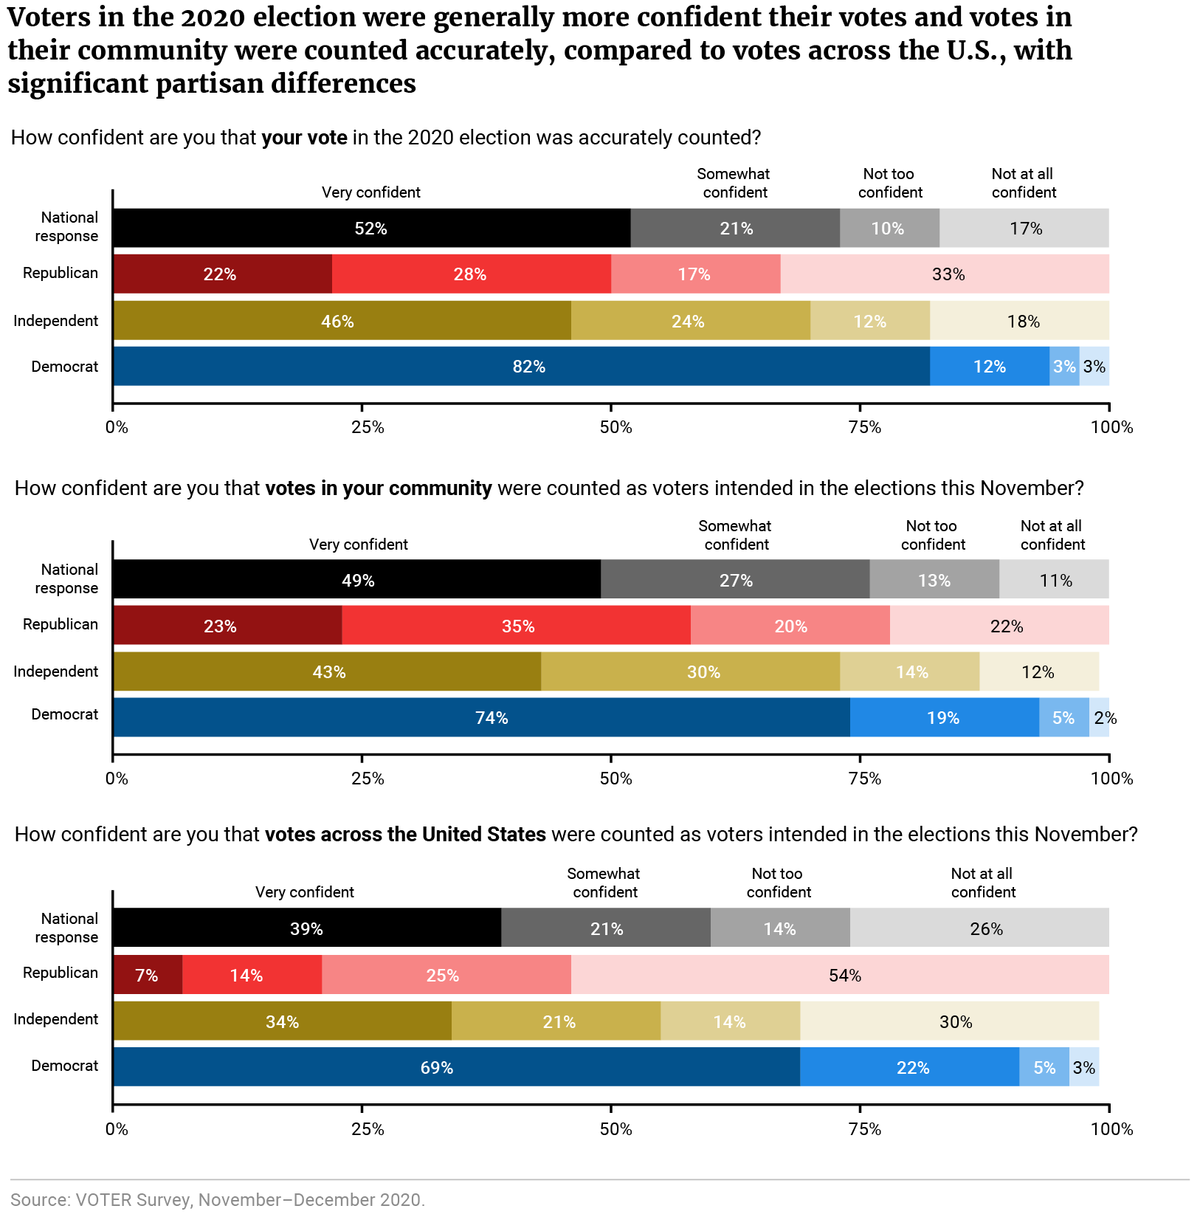
The 2020 post-election VOTER Survey also shows a partisan chasm in responses about whether people’s own votes were counted accurately. In this survey, people were almost equally confident that their own vote (73 percent very or somewhat confident) and votes in their community (76 percent very or somewhat confident) were counted accurately. They were less confident that votes across the U.S. were counted as intended, at 60 percent. Democrats participating in the VOTER Survey were highly confident that their own vote, votes in their community, and votes across the country were correctly counted. Republicans were much more pessimistic than Democrats about each of the three scenarios the VOTER Survey described. Fifty percent of Republicans were very or somewhat confident about their own vote, 58 percent about the votes in their community, and only 21 percent about votes across the country. In contrast, 94 percent of Democrats were very or somewhat confident about their own vote, 93 percent about the votes in their community, and 91 percent about votes across the U.S. (Figure 4, Table A-4).
Looking at vote confidence along racial lines reveals that Black voters were the most confident that their own votes were counted accurately (93 percent reported being very or somewhat confident); Hispanic (73 percent) and white voters (70 percent) were much less confident that their votes were counted accurately. The pattern is similar for confidence in accurate vote counts in their communities (86 percent of Black people, 74 percent of Hispanics, and 74 percent of white people) and votes across the U.S. (84 percent of Black people, 66 percent of Hispanics, and 52 percent of white people).
These results reveal a polling truism: People are generally more positive about things closer to home than what is happening nationally. The authors of this analysis tend to trust what people say about their own experiences more than we trust what they say about national developments. Additionally, while those who vote for the ultimate winner of an election are usually more confident about an accurate count, the results from the 2004 and 2020 elections show an exceptional level of partisanship.
Figure 4

As elected officials in Washington and around the country begin to consider reforms that might be made to voting procedures, it is important to know that in this deeply polarized age, the vast majority of Republican, Democrat, independent, Black, white, and Hispanic Americans did not encounter significant difficulties voting during Election 2020. Many state legislatures have enacted reforms that some view as protecting the integrity of the ballot. Others view these changes as efforts to curtail voting rights. Predictably, partisans have different views. But as 2020 showed, even in the face of an unprecedented pandemic, election officials did their jobs well in most places, and most people felt confident in the accuracy of their own ballot and the votes in their communities.


Subscribe to our mailing list for updates on new reports, survey data releases, and other upcoming events.