
Opinion: Issues Matter in Elections Even More Than You’d Think
David Winston
Roll Call December 13, 2017
Elections, Ideology, Political Parties

Key Findings
The ascendance of President Donald Trump and his brand of conservative nationalism prompted a fair degree of debate over the nature of the Republican Party’s electoral coalition. However, the Democratic Party faces significant fragmentation threats of its own. Our data — from the 2017 VOTER Survey (Views of the Electorate Research Survey) — uses differences in issue prioritization as a basis for analyzing the electorate as a whole. By categorizing the electorate according to the importance they place on policy issues, we can draw broader conclusions about the political coalition of each party. What emerges in this report is a perceptible split between the two main groups that vote Democratic. On the issues, the Democratic Party faces a substantial divide between the two critical elements of its electoral coalition.
This report uses the same analytic framework as an earlier, related report for Voter Study Group, “Placing Priority: How Issues Mattered More than Demographics in the 2016 Election,” which was published in December 2017. That report examined data from 8,000 respondents in the 2016 VOTER Survey and categorized the results by how voters view issues, rather than by their demographic attributes or party affiliation. The research involved a k-means cluster analysis on the dataset to group the electorate using their prioritization of issues on a Likert scale, which allowed for a grouping of the electorate into five distinct voting “clusters.” In “Placing Priority,” these groups were named Democrat/Independent Liberal Elites (DILE), Democrat-Leaning Working Class (DLWC), Moderate Younger Middle-Income (MYMI), Conservative Younger (CY), and Conservative Older (CO).(1) Each one of these groups, formed based on issue priorities rather than demographics, exhibited distinct political and ideological preferences.
In a follow-up Voter Study Group report, “Placing Priority, Part II: Issues Continue to Matter More than Demographics,” we used data from a second poll that surveyed 5,000 of the original respondents — the July 2017 VOTER Survey — to conclude that organizing the electorate by issue prioritization cluster analysis stands up to a measure of repeatability. While the methodology and sample were largely the same as in 2016, this was a wholly separate statistical test. “Placing Priority, Part II” shows that voters grouped in ways similar to those identified through the previous analysis, revealing the consistency of respondents’ issue preferences. Thus, over two independent statistical events, voters “clustered” with enough coherence to justify using this method as a means to analyze the electorate more broadly.
These two previous reports established the reliability of the cluster analysis method; this report focuses primarily on interpreting the results of this method. Instead of identifying Democratic voters specifically, this study flips the model to sort respondents by issue preferences, which reveals insights about the broader electorate and the place of the Democratic Party within it. Thus, the balance of this analysis will focus on the two distinct clusters that lean most consistently Democratic: DILE and DLWC. These two cluster groups differ greatly by their issue prioritization, and when compared to the Republican-leaning groups, they offer a clue to understanding the challenges that the Democratic Party faces as it seeks a path back to electoral success.
(1) These labels — which largely reflect ideology — were chosen to help us to make sense of the different cluster groups within the context of our standard political discourse. They were not premeditated or purposefully designed to fit specific ideological categories; rather, the names were assigned based on the characteristics observed about each separate cluster. Cluster boundaries were “drawn” around critical masses in the data.
Respondents in the 2016 and 2017 VOTER Surveys were asked how they would prioritize 23 issues — as “very important,” “somewhat important,” “not very important,” or “unimportant.” To narrow the findings and to determine what issues animated the electorate to the greatest extent, we used the “very important” category as the benchmark for issue prioritization. In the 2017 VOTER Survey, the average respondent identified 12 issues as “very important,” while in the 2016 VOTER survey, the average respondent identified 11 issues as “very important.” These numbers — which are smaller than numbers in the “somewhat important” category — suggest that “very important” responses are a more practical measure of voting behavior. Earlier reports in this series expand on this model and also rank the 23 issues by the percentage of the electorate that denoted each issue as “very important.”
To group the electorate based on these responses, we ran a k-means cluster analysis on issue prioritization. We altered the number of possible groupings within the confines of a reasonable iteration process; the result that produced five clusters provided for the clearest statistical differences between each group.(2) Voters coalesced around a similar set of issue priorities in five distinct clusters. This was the case for both the 2016 and 2017 data. Further, most respondents maintained their membership in a similar cluster group across both surveys.(3) This level of coherence between the two independent tests was significant enough to justify retaining the cluster names and allowed for easier comparison.
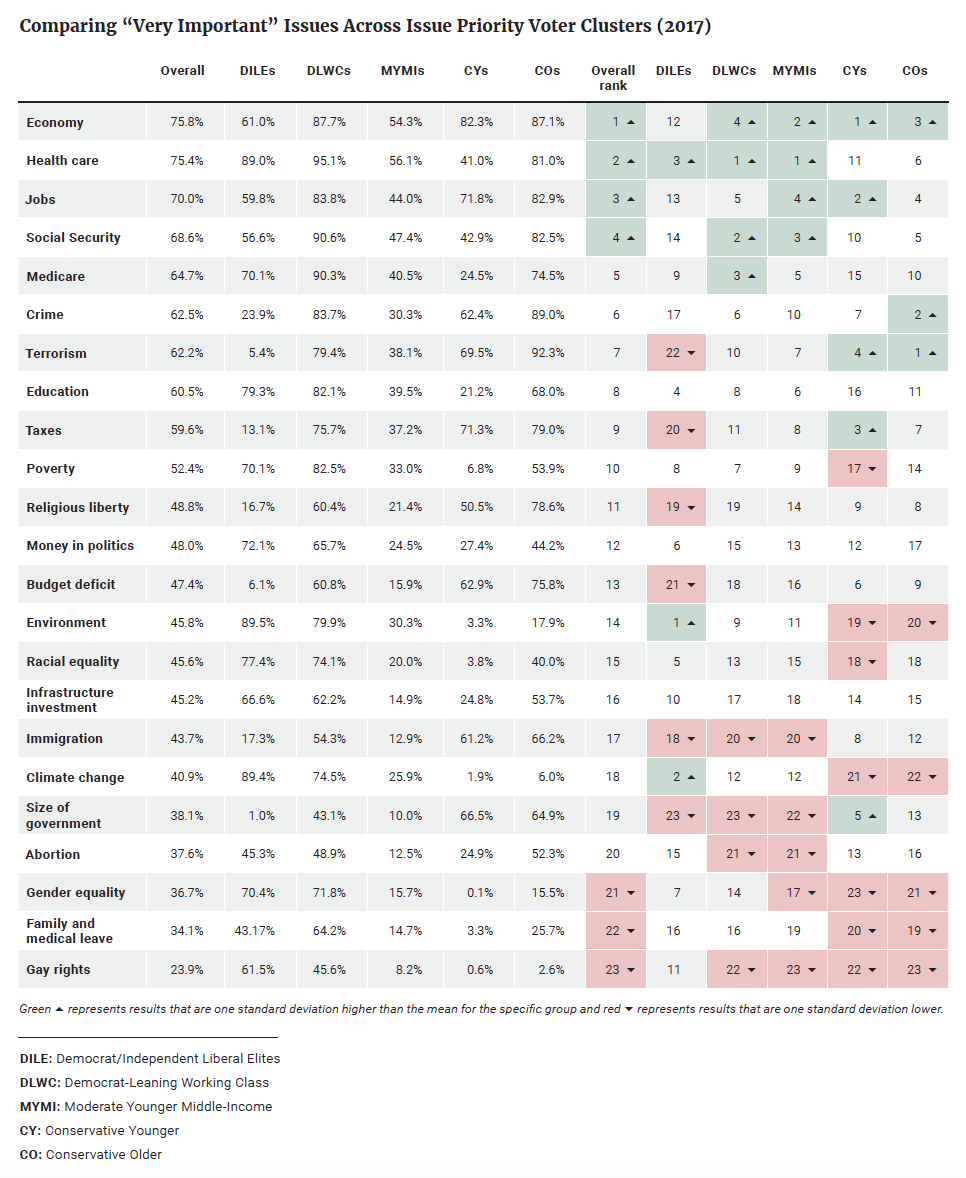
We calculated the percentage of voters who identified an issue as “very important” within each separate cluster and across the overall electorate (Table 1). We also ranked each of these issues by cluster group from highest to lowest percentage of the cluster deeming the issue “very important.”
Through color-coding, we show significant differences in how each cluster (and the overall electorate) defined the importance of a particular issue compared to other issues. Green represents an issue that was chosen by a percentage of the group that was one standard deviation higher than the mean for issues for that cluster. Red represents an issue that was one standard deviation lower. Issues one standard deviation above and below approximately represent the top and bottom 16 percent of issues relative to the means, a reasonable reflection of priority for our purposes. The use of standard deviation as a differential provides a useful benchmark to compare issue priority across the clusters and also helps better illustrate the issues that are high-priority (and those that were lower priority) for each cluster. Table 1 shows that some cluster groups assign higher relative percentages of “very important” to all the issues; using a standard deviation helps us to smooth over these differences and normalize the results across cluster groups for comparative purposes.
(2) Approximately 10 percent of the electorate was not identified in any cluster. This was because these respondents did not answer all 23 questions that were tested in this analysis. Because this group looks, demographically, like a cross-section of the overall electorate, we can assume that our five issue clusters are not “missing” a specific type of voter.
(3) Overall, about 70 percent of respondents remained in the same cluster group from 2016 to 2017. Respondents who were captured by a new cluster in the second year were typically those whose Euclidean distance from the cluster center was larger; in another sense, the ones who moved were those originally closer to the margins. A detailed chart illustrating how the clusters changed across both surveys can found in the Appendix of “Placing Priority, Part II.”
Table 1
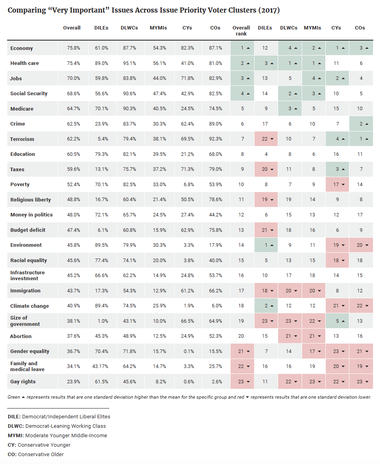
What emerges from this data is a clear division between the issue preferences of the DILEs and DLWCs. The latter group shares the economy as a high-priority issue with every cluster but the DILEs. DLWCs are also closer to conservative and moderate voters on jobs, crime, terrorism, and Social Security, which are high-priority issues (or close to it) for all clusters except the DILEs. And the top two issues that DILEs highly prioritize — environment and climate change — rank only ninth and 11th among DLWC voters, respectively.
The two Democratic-leaning clusters do share some issues in common. Health care is the main unifying factor, with both groups deeming it a high-priority issue. On the opposite side of the scale, both groups rank the size of government as their least prioritized issue.
Notwithstanding these similarities, the Democratic coalition is much further apart on the issues than their Republican-leaning counterparts. Compared to DILE and DLWC voters, who share only one high-priority issue, CY and CO voters each rank the economy and terrorism as high-priority issues, and they are close on jobs, crime, and taxes. While these two groups assign slightly different priorities to Social Security and Medicare, these differences can be readily explained by age and generational preferences. It should be no surprise that CO, over 60 percent of whom are age 55 or older, would prioritize entitlement programs more than their younger conservative counterparts.
These two Republican-leaning clusters show even more uniformity on the issues they deem less of a priority. While DILEs and DLWCs agree only on two lower-priority issues — immigration and size of government — the two Republican-leaning groups have the same five issues at the bottom of their respective rankings. CYs and COs each assign lower prioritization to gay rights, family and medical leave, gender equality, climate change, and the environment. In fact, DLWCs share with the Republican-leaning groups a lower prioritization of gay rights, which is the least-prioritized issue (or nearly so) for all clusters of the electorate except DILEs.
Having established the relatively larger differences in issue prioritization among DILEs and DLWCs, we can flip the model and look at demographic attributes of each cluster. What do these two clusters look like?
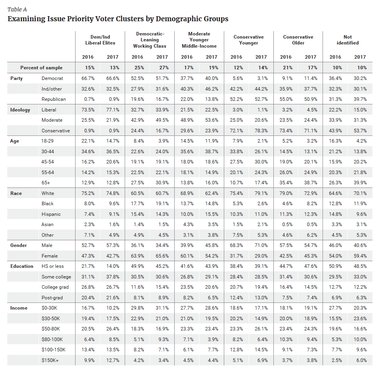
The 2017 VOTER Survey data reveal stark demographic differences behind these issue preferences. DILEs (13 percent of the electorate) are heavily Democratic (67 percent) and liberal (77 percent), and are less than 1 percent Republican or conservative. They are also the youngest group, with 51 percent under 45 years old. The DILE cluster has the second-highest percentage of white voters (75 percent), behind only the CY cluster (79 percent). Their educational attainment is the highest of all the groups, as 86 percent have some college/an associate’s degree or more, with 48 percent having graduated college, and 22 percent having done post-graduate work. Finally, they have the highest income — with 26 percent making $100,000 or more, and only 10 percent making $30,000 or less.
In contrast, the DLWC cluster (27 percent of the electorate) is the group with the largest non-white population; 39 percent of voters in this cluster identify as non-white. The majority of this group identifies as Democratic (52 percent), and a high proportion identifies as independent (32 percent). Ideologically, moderates make up the largest share (50 percent) of this group, though liberals outnumber conservatives 34 percent to 17 percent. This is the second-oldest group, with 53 percent age 55 or older, and only 4 percent under age 30. Significantly more people within this group are female (66 percent). In terms of education, only 24 percent have a college degree or more, while 45 percent have a high school diploma or less. DLWCs also have the lowest average income; over half of this group (52 percent) makes $50,000 or less.
Thus, the data show that apart from major differences over issue prioritization, the two clusters that make up the Democratic coalition are also very demographically distinct.(4)
(4) See the full demographic breakdown for each cluster for the 2016 and 2017 VOTER Surveys in Table A of the Appendix.
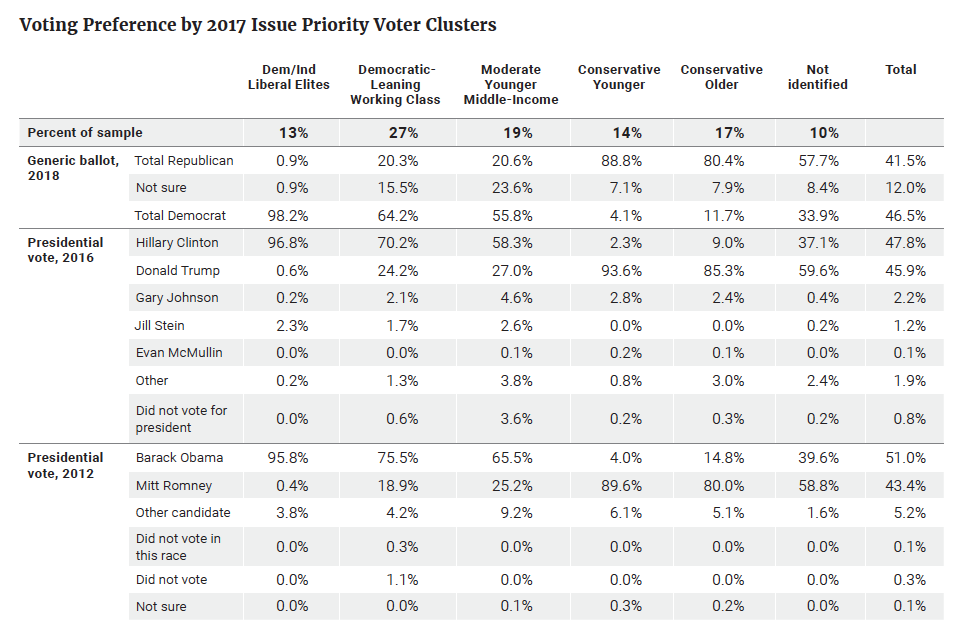
Having determined issue preferences and reviewed the demographic makeup of these groups, the question becomes, how do the clusters vote? Mapping the issue clusters onto their voting preferences reveals some interesting patterns within the Democratic coalition. For one, the DILEs voted almost unanimously for Hillary Clinton in 2016 and Barack Obama in 2012, and they picked Democrats for congressional preference in 2018 by an overwhelming margin (Republicans scored less than 1 percent). Even Green Party candidate Jill Stein and write-in candidates outperformed Donald Trump and Mitt Romney, respectively, among this group (Table 2).
The two conservative-leaning clusters together nearly reach this level of unanimity, with 94 percent of CYs and 85 percent of COs choosing Donald Trump in 2016. The MYMI cluster was predictably split but leans Democratic, with the majority of voters going to Hillary Clinton (58 percent) compared to 27 percent for Donald Trump. It is interesting to note that Hillary Clinton underperformed among MYMIs by about seven points compared to Barack Obama in 2012; Trump picked up only about 2 percent of these voters, suggesting that perhaps some MYMIs flocked to a third party.
Tabe 2
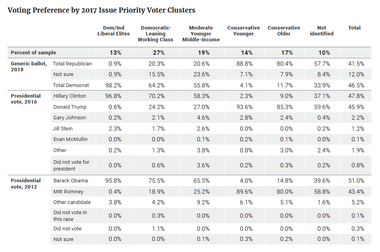
What is especially interesting in the 2017 VOTER Survey, however, is the split among DLWC voters — Trump made inroads into this group in 2016, capturing nearly 25 percent of the DLWC vote compared to 70 percent for Clinton.(5) This percentage for Trump was especially significant because only 17 percent of DLWC voters were registered Republicans in 2017. Thus Trump measurably improved upon his party’s historic standing with these voters; Mitt Romney captured only 19 percent of this cluster in 2012. The cluster group analysis for 2017 reveals that DILEs and DLWCs are much less symmetric in their voting preferences than CYs and COs. DLWCs generally provide around 20 percent of their votes to Republicans, while DILEs do not exceed 1 percent (Table 2).
These patterns were not limited to ballot tests. On presidential approval rating, the same general pattern holds true (Table 3). As of the July 2017 VOTER Survey, there was almost unanimous disapproval (99 percent) of President Trump among DILEs; in contrast, nearly 23 percent of DLWCs supported the president. Among CYs and COs, there was far more consistency, with 89 percent and 80 percent of these voters approving of the president, respectively.
In essence, this data helps us to better understand the dynamics of the 2016 presidential election in the context of the issues. Hillary Clinton’s campaign, which had significant focus on climate change, racial and gender equality, and gay rights as important issues, was received positively by DILEs (nearly 97 percent of whom voted for Clinton). However, in the primary against Senator Bernie Sanders, she found herself defending the economic record of President Obama, which subsequently caused her to become the candidate of the status quo. Donald Trump — with his significant focus on trade deals, tax cuts, and bringing jobs home — more directly incorporated economic change into his overall campaign message, yielding a meaningful boost from DLWCs, a far larger cluster group by percent of the electorate. This magnified Trump’s appeal among the four clusters — DLWC, MYMI, CY, and CO — that ranked the economy and jobs as top issues. According to national exit poll data, among those voters who said the economy was “not so good,” Trump won an absolute majority over Clinton, 53 percent to 40 percent.
(5) In the cluster data from the 2016 VOTER Survey, Trump’s success with the DLWC group was even more pronounced. Only 65 percent of DLWCs voted for Clinton, while fully 29 percent supported Trump.
In the world of political analysis, conventional wisdom often holds that certain demographic groups vote in specific patterns, with white voters, for example, moving toward the Republican Party over the last several decades. That is often the case, but sometimes these generalizations risk running ahead of the data. If we organize the electorate by issue prioritization, however, a somewhat different picture emerges. In this analysis, a homogenous cluster of high-income and highly educated mostly white voters — DILEs — votes almost unanimously Democratic, rather than Republican. The most diverse cluster, DLWCs, provides a good portion of its votes to Republicans. Oftentimes popular, easily comprehensible explanations based on demography, such as white working-class voters went to Trump, can obscure and diminish other relevant details, like the fact that Trump actually lost the union vote by about nine points.(6) A demographics-only approach can be a relatively blunt analytical instrument.
The examples presented in this report, among others, suggest that it’s wise to use some caution when assigning political preferences to specific demographic groups, which often contain within them a rich variety of issue preferences. It follows that any demographic analysis of voting patterns would be greatly enhanced if placed alongside the issue groupings described throughout this report. In some cases, demographics provide superior predictive power; in other cases, they are simply too broad to tell the whole story. Alongside demographics, issue prioritization is an equally valid method by which to organize the electorate, and in many ways the two are complementary.
(6) This data comes from the national exit polls completed by Edison Research for the news and media organizations that comprise the National Election Pool.
We should note that there are certainly other ways to map voting behavior around issues that may produce somewhat different results. One can, for example, more carefully probe questions of national identity and morality, which may show other divisions. While these analyses absolutely have salience, we believe they must be placed in context when considering what factors truly drive voting behavior. According to our study, the issue that ranked first in prioritization among the overall electorate was the economy, not issues of morality or identity. This fact invites deeper examination of groups, like the DILE cluster, that assign a relatively lower prioritization to issues, such as the economy (12th) and jobs (13th), which rose to the top among other groups.
To conclude, when weighing the importance of issues in voting patterns, the Democratic Party exhibits perceptible and significant differences between its two principal voting groups. Recent primary elections — which have pitted progressive contenders against more centrist candidates — reflect this divide and foreshadow the careful balancing act Democratic leaders must play in the 2018 midterm elections to hold their coalition together. With the two poles of their party fixated on two very different of sets of issues, Democrats may have to navigate even greater divisions in the years ahead.


Subscribe to our mailing list for updates on new reports, survey data releases, and other upcoming events.


