
Opinion: The three reasons American elections are always so close
The Washington Post November 4, 2022
With the 2020 Democratic primary season well under way, many political analysts — and not a few Democrats — have wondered which of the party’s candidates is most electable. But there’s another candidate with an electability challenge: President Donald Trump. His personal favorability and job approval numbers are relatively low, the 2018 midterm revealed notable divisions within the coalition that elected him, and those divisions are already apparent in his bid for re-election.
Using data from the 2019 VOTER Survey (Views of the Electorate Research Survey), I examine Trump’s favorability, how groups voted in 2018, and what some of this very early data can tell us about 2020. I draw on the responses of 6,779 Americans, most of whom had been surveyed previously as part of a longitudinal panel. This panel provides a unique window into how the same Americans voted over time — in 2012, 2016, and 2018 — and thus on how they may vote in 2020.
Three findings stand out. First, Trump has never been particularly popular compared to other presidential candidates or presidents. While he is famously focused on his “base,” we find that only 37 percent of Americans have consistently held a favorable opinion of the president. Second, defections among Republican-leaning voting groups hurt Republicans in the 2018 midterm election. Notably, more than one-third (37 percent) of Obama-Trump voters reported voting for a Democratic candidate in 2018. Finally, the same Republican-leaning groups that defected in 2018 are also those who appear likeliest to vote for a Democratic presidential candidate in 2020.
One of the most durable features of Trump’s candidacy and presidency is his unpopularity. During the 2016 campaign, Gallup surveys found that he was less popular than every presidential candidate in the general election since 1952. During his presidency, Trump has never managed to get a majority of Americans to have a favorable opinion of him or approve of the job he is doing as president. His favorability in the VOTER Survey was highest right after the 2016 election (44 percent) and has declined slightly since that time — just four in 10 (40%) Americans held a favorable opinion of the president after the 2018 election. Similarly, just 42 percent of respondents approved of the job Trump was doing as president after the 2018 election.
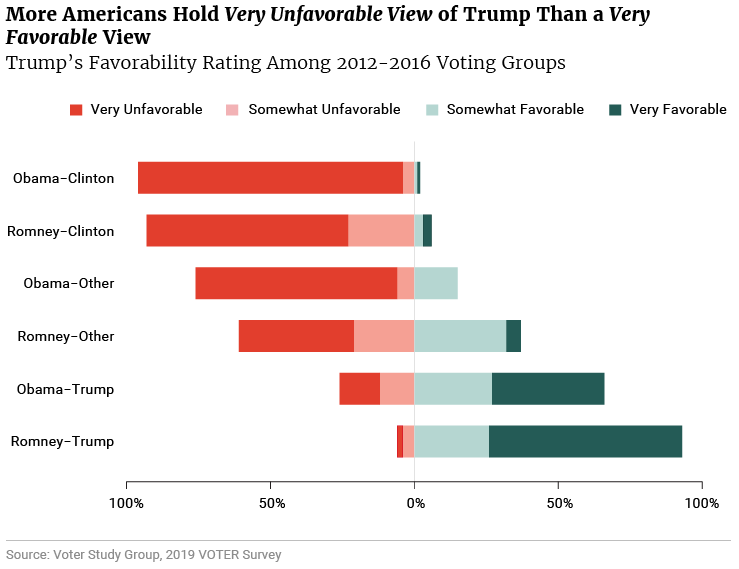
Trump’s favorability among key voting groups is also low. Majorities of Obama-Clinton voters (96 percent), Romney-Clinton voters (93 percent), Obama-third-party voters (76 percent), and Romney-third-party voters (61 percent) had an unfavorable opinion of the president after the 2018 midterm election. Only among Romney-Trump (93 percent) and Obama-Trump (66 percent) voters did a majority have a favorable opinion of Trump. Notably, there has been a 19-percentage-point drop in favorability among Obama-Trump voters since late 2016 (85 percent vs. 66 percent).
There is a further challenge for Trump: The support he does have is relatively “soft” compared to the opposition he faces. There are almost twice as many Americans who hold a very unfavorable view of the president as there are those who hold a very favorable view (49 percent vs. 25 percent). While majorities of Obama-Clinton (92 percent), Romney-Clinton (70 percent), and Obama-third-party (70 percent) voters have a very unfavorable opinion of the president, it is only among Romney-Trump voters that a majority (67 percent) have a very favorable opinion. Just 39 percent of Obama-Trump and 5 percent of Romney-third-party voters hold a very favorable opinion of Trump.
Although there are many definitions of Trump’s “base,” one reasonable definition is Americans who have “consistently been a strong supporter.” Using responses from the 2016, 2017, 2018, and 2019 waves of the VOTER Survey, we can track how Americans have felt about the president over time. While over one-third (37 percent) of Americans have consistently held a “somewhat” or “very” favorable view of the president, just 17 percent have consistently held a very favorable view.

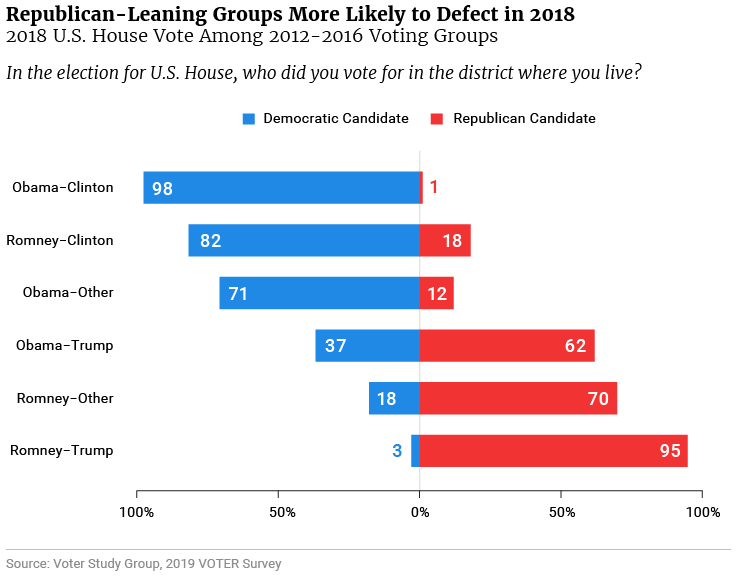
A more concrete warning sign for Trump comes from the 2018 election. In terms of national vote share, Democratic candidates for the U.S. House did five percentage points better than they did in 2016 (53 percent vs. 48 percent) while Republican candidates did about four percentage points worse (45 percent vs. 49 percent).
These Democratic gains were predicated not just on mobilization but on winning over some voters who had previously supported Trump. While 97 percent of Clinton voters supported the Democratic candidate in their district, a somewhat smaller share of Trump voters supported the Republican candidate (92 percent).
Among the voting groups examined above, Republican-leaning groups were generally more likely to defect in 2018 than their Democratic counterparts. While 82 percent of Romney-Clinton voters supported the Democratic candidate in their district, only 62 percent of Obama-Trump voters supported the Republican candidate. Almost four in 10 (37 percent) Obama-Trump voters supported a Democratic congressional candidate in 2018.
Similarly, Obama-third-party voters favored Democratic House candidates by 59 percentage points (71 percent Democratic vs. 12 percent Republican) while Romney-third-party voters favored Republican candidates by 52 percentage points (18 percent vs. 70 percent).
It was only among those groups who consistently voted for either Democratic or Republican presidential candidates in 2012 and 2016 that there were roughly equal levels of party support. Strong majorities of Obama-Clinton (98 percent) and Romney-Trump (95 percent) voters supported their respective parties in 2018.

The 2019 VOTER Survey also asked respondents who they would vote for if the 2020 election were held today – and their responses do not bode well for the president. While there’s uncertainty about the value of early polling data in any election, other VOTER Survey findings suggest that Americans are increasingly certain about the party they are going to support even when asked very early in the election cycle.
In December 2011, respondents were asked who they would vote for in the then-upcoming House of Representatives race in their district as well as who they would vote for in the presidential race. The overwhelming majority of respondents voted for a congressional (88 percent) and presidential (90 percent) candidate that was consistent with those earlier responses or, if originally uncertain, consistent with their approval or disapproval of the president.
If anything, voters were even more predictable in the 2018 midterms. In July 2017, VOTER Survey respondents were asked who they would vote for in the 2018 House race in their district. More than nine in 10 (93 percent) respondents voted for a congressional candidate that was consistent with those responses from more than a year before the election.
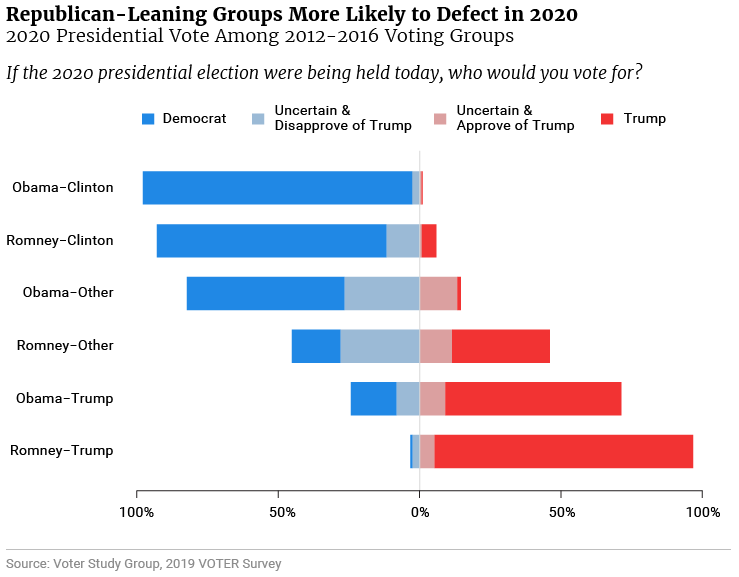
Using that same approach on the early data available in the 2019 VOTER Survey suggests that President Trump is walking into a challenging election. Directly after the 2018 election, a majority of Americans said either that they would vote for a generic democratic candidate in 2020 (48 percent) or that they were uncertain and disapproved of President Trump (6 percent). Just four in 10 said they intended to vote for Trump (36 percent) or were uncertain and approved of the president (4 percent). One percent of voters were uncertain and neither approved nor disapproved of the president while 5 percent said they would not vote in 2020.
Among those same six voting groups, we see 2020 vote intentions that roughly mirror how these people behaved in 2018. Most of those who consistently voted for one party’s presidential candidates in 2012 and 2016 also appear likely to support that party in 2020. Most Obama-Clinton voters said they would vote for the Democratic candidate (95 percent) or were uncertain disapprovers (3 percent). A similar number of Romney-Trump voters said they would vote for Trump (91 percent) or were uncertain approvers (5 percent).

As in 2018, Republican-leaning groups showed a higher potential for 2020 defection than their Democratic counterparts. For example, more than nine in 10 Romney-Clinton voters said they would vote for the Democratic candidate (81 percent) or were uncertain disapprovers (12 percent). By contrast, just about seven in 10 Obama-Trump voters said they would vote for Trump (62 percent) or were uncertain approvers (9 percent). About one-quarter of Obama-Trump voters said they would vote for a Democratic candidate (16 percent) or were uncertain disapprovers (8 percent). While the majority of Obama-Trump voters may now feel at home within the Republican party, these results suggest that a substantial portion may still be regular supporters of the Democratic party.
Similarly, Obama-third-party voters were more likely to fall into Democratic-leaning categories (55 percent said they would vote for a Democratic candidate and 27 percent were uncertain disapprovers) than Romney-third-party voters were to fall into the complimentary Republican-leaning categories (34 percent for Trump and 11 percent uncertain approvers).
With the majority of the 2020 campaign ahead of us, early data should be considered with caution. A wide variety of factors — including the identity of the Democratic nominee — are still in flux. However, Trump’s historic unpopularity, the losses his party suffered in 2018, and early data on voters’ intentions for 2020 suggest he enters the election with some significant obstacles to overcome.
Robert Griffin is the research director of the Voter Study Group. Views expressed here are his own and do not necessarily reflect those of the collective Voter Study Group.


Subscribe to our mailing list for updates on new reports, survey data releases, and other upcoming events.
