
Purple America Has All But Disappeared
FiveThirtyEight June 9, 2017

The 2016 Presidential election was one of the most contentious and unpredictable in recent decades. Donald Trump is the first president since 1876 to win an Electoral College majority while losing the popular vote by over 2 percent, and his election remains deeply controversial. How did it happen? What do his voters want? What might their embrace of him, despite many statements that offended or shocked tens of millions of Americans, mean for the future of American democracy?
Trump’s rise is not unique in today’s world. Europe was shocked in June 2016 when the United Kingdom chose to leave the European Union, and political leaders and parties echoing many of Trump’s messages concerning immigration and the nature of national identity exist and in many countries in the West. The runner-up in the recent French presidential primary election, Marine Le Pen, is merely the most prominent of this type. Nor is this “populism” limited to Trump-like figures. Other aspects of populism are flourishing on the left, perhaps best observed in the rise of parties like Syriza in Greece and Podemos in Spain. The United States saw such a figure arise in 2016 as well in the form of Vermont Senator Bernie Sanders, who rose from near obscurity to be a serious contender for the Democratic Party presidential nomination.
The Democracy Fund, a charitable foundation committed to the protection and enhancement of democratic values, found the rise of these movements and candidates worthy of analysis. In May 2016, the Democracy Fund chose to begin a rigorous project that would supply hard data to test proposed theories to explain these phenomenon. Working with Henry Olsen of the Ethics and Public Policy Center and John Sides of George Washington University, the Democracy Fund assembled a diverse group of scholars and analysts representing political viewpoints from all angles. The group devised original surveys of American voters to begin to answer the key question of our time: what does the rise of these movements and political figures mean for the future of our democracy?
To that end, we commissioned a unique survey that asked a representative sample of 8,000 Americans a wealth of questions about their political beliefs, their economic and social concerns and status, and much more. The VOTER Survey — methodological details of which are provided at the end of this summary — is unique for two reasons.
First, it is a panel survey: most of the 8,000 respondents also responded to a survey in 2012 that included many of the same questions, including their self-reported vote for president in the 2012 election. The VOTER Survey therefore allows us to determine accurately the characteristics and beliefs of people who switched their partisan support.
Second, the sheer size of the sample allows analysts to dig more deeply into smaller groups of the American electorate than most other surveys. Most national surveys ask 800 to 1,200 Americans about their views. Large surveys rarely exceed 2,000 to 3,000 respondents. This limits the ability to measure the attitudes of smaller demographic groups or political factions accurately. The size of the VOTER Survey allows analysts to examine the views of groups that switched from 2012 to 2016 such as Obama to Trump or Romney to Clinton voters with significant accuracy. Other surveys cannot do this.
There are other unique aspects to this project. It will field another survey in the early summer that includes some of the VOTER Survey's questions as well as entirely new avenues of inquiry.
For their first survey, we invited Voter Study Group members to contribute papers based on the data. A summary of the first four papers follows, with more to come. Each paper is then discussed in more detail.
This summary elaborates on each of these points below, and the four papers that are part of this report go more deeply into these questions.
Some will be tempted to conclude that people providing negative responses toward a group in survey responses are guilty of bigotry or prejudice. We want to be clear: this inference is not a fair reading of these data. Attitudes toward members of racial, ethnic, religious, or other social groups are complicated, and, as noted earlier, this survey is not designed to explain “why” people reported these feelings. We will conduct further research in an attempt to understand the “why” behind this “what.”
The views of the report writers for this first stage of this project — John Sides of George Washington University, Robert Griffin and Ruy Teixeira of the Center for American Progress, Lee Drutman of New America, and Emily Ekins of the CATO Institute — are their views alone. They do not represent the views of the Democracy Fund or the members of its advisory panel. We expect to commission additional papers as we go forward. Below is a more detailed analysis of some of the summary points above.
George Washington University political scientist John Sides found that 83 percent of 2016 voters were “consistent partisans,” meaning they backed the candidate of the same party whose candidate they had supported in 2012. “This level of consistency from one presidential election to the next is typical. ... The 2016 election did not create more instability, in the aggregate, than others.”
Sides found that 86 percent of Obama 2012 voters voted for Clinton while nearly 89 percent of Romney voters supported Trump. Nine percent of Obama voters voted for Trump while 5 percent voted for a third-party candidate or a write-in, while 5 percent of Romney voters supported Clinton and 6 percent voted for a third-party candidate or write-in.
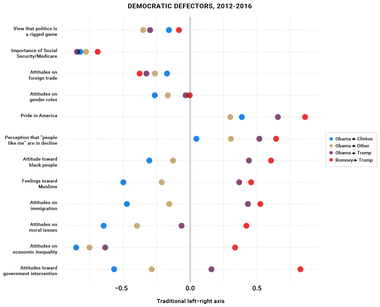
Sides looked specifically at white voters who cast ballots for the candidate of the opposing party in 2016 (i.e., Obama to Trump and Romney to Clinton voters). He constructed indexes grouping different questions asked in the 2011 survey that addressed a similar topic to gauge whether attitudes on that topic correlated with a vote switch. He found that attitudes about legal and illegal immigration were strongly correlated with vote switching. Those who favored a path to citizenship for immigrants not legally resident and held beliefs that unauthorized immigrants contribute to American society were more likely to switch from Romney to Clinton. Those who opposed an easier path to citizenship and held beliefs that immigrants detract from American society were more likely to switch from Obama to Trump.
Sides also found a correlation between beliefs about black people’s ability to progress in American society and feelings toward Muslims with vote switching. Voters who thought black people ought to and could move up in American society without special favors like prior immigrants groups who faced prejudice were more likely to switch from Obama to Trump, while those who disagreed were more likely to switch from Romney to Clinton. With regards to Muslims, voters expressing more negative feelings toward Muslims were more likely to switch from Obama to Trump, but those reporting more positive feelings were not more likely to switch from Romney to Clinton.
CATO Institute scholar Emily Ekins used cluster analysis to examine the people who voted for Trump in the general election. She found that these voters broke into five groups:
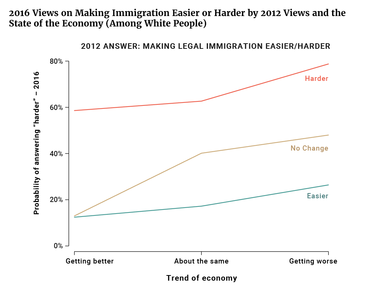
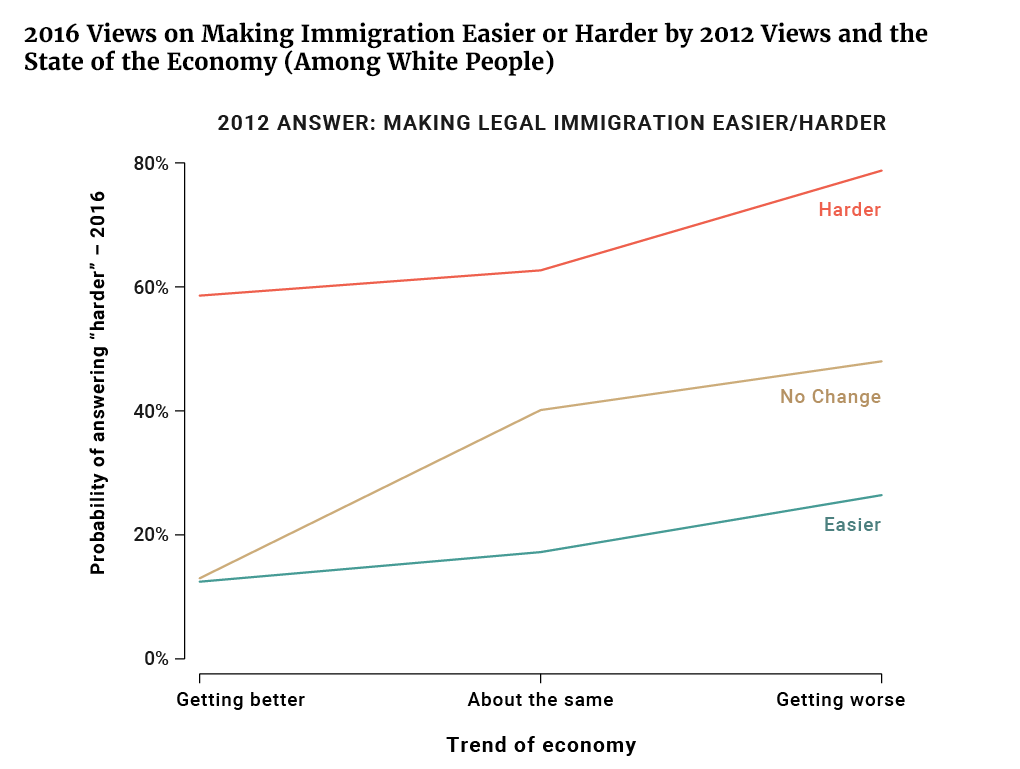
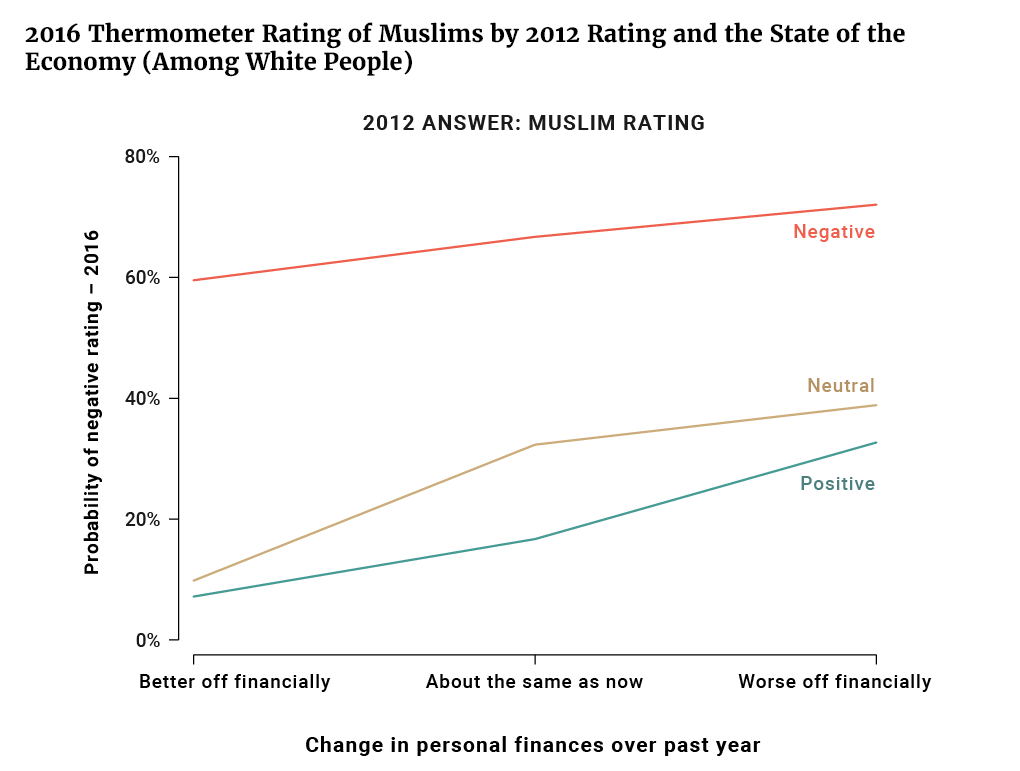
Center for American Progress scholars Robert Griffin and Ruy Teixeira looked at the relationship between views of economic pessimism and views expressing cultural pessimism or nativism. They found that “pessimism about the state of the economy played a minor role in Trump’s primary success but a substantial role in his general election win.” This was consistent with the historical record regarding the rise of populisms of the right in America and abroad. Political expression of concern about immigration and/or immigrant groups are often preceded by periods of economic shock and decline or extended periods of stagnation for the group expressing those views.
Teixeira and Griffin found that opposition to legal immigration and negative views of Muslims, for example, increased between 2012 and 2016 depending on a respondent’s view regarding their personal finances and the general economy’s performance. “Those who experienced negative economic attitudes in 2012 were more likely to express key negative cultural attitudes in 2016 even taking into account their earlier answers to the same questions.”
2016 Thermometer Rating of Muslims by 2012 Rating and the State of the Economy (Among White People)

Views regarding immigration and ethnicity, then, would have been less salient to the 2016 election had continued economic pessimism, especially among the white, noncollege voters whose support gave Trump his win, not “activated” those views and made frustrated people more likely to hold them.
Intriguingly, both Sides and Griffin/Teixeira found that a voter’s views on free trade did not significantly impact their willingness to deviate from their prior partisan voting habits. That is not to say that views on this issue had no effect. New America scholar Lee Drutman, for example, found that 2012 Obama voters who voted for Trump held less favorable views on trade than did Obama 2012 voters who either supported Clinton or who voted for another candidate. However, all three papers found that differences on other issues were much greater between the candidates’ sets of supporters or predicted a higher likelihood to switch partisan support than did thoughts about whether free trade was good or bad for America.
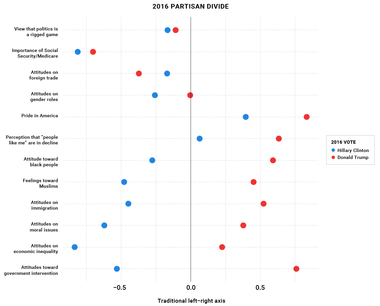
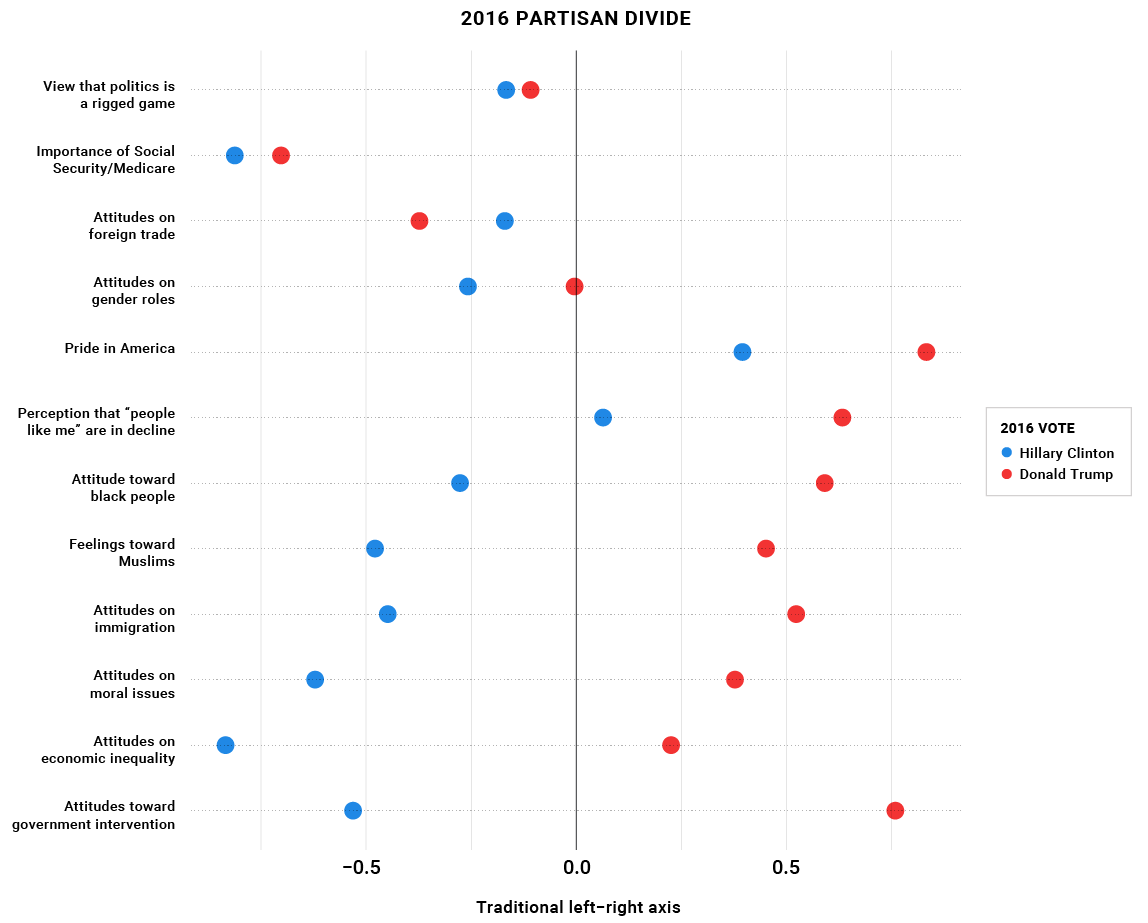
Drutman also looked at the divides within and between the two parties’ coalitions. With respect to the Democrats, he found that most of Hillary Clinton’s general election support came from voters who largely took traditionally liberal views on economics, social issues, and issues respecting national identity. Nearly 45 percent of all voters could be classified as holding these consistently liberal views, and Clinton received 83 percent of their votes. Nearly 78 percent of her total support came from these voters.
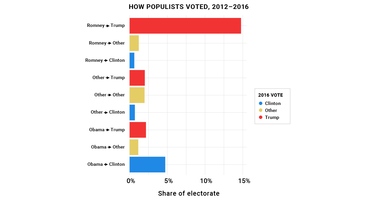
Nearly all of the remainder of Clinton’s support came from people who hold center-left views on the economy and the role of government but center-right views on matters of immigration and national identity. About 12 percent of her support came from these voters, who comprise 29 percent of the electorate. Most of the Obama to Trump voters were among these voters, whom Drutman labeled “populists.”
Despite the bitter primary battle between Secretary Clinton and Senator Sanders, surprisingly little divided their voters on issues. Sanders and Clinton voters held nearly identical views on immigration, social issues, and economic concerns. They differed primarily on “disaffection.” Sanders voters were more likely to view politics as rigged, and less likely to express pride in America. Sanders voters also held more anti-trade views and less pro-Muslim attitudes than did Clinton supporters.
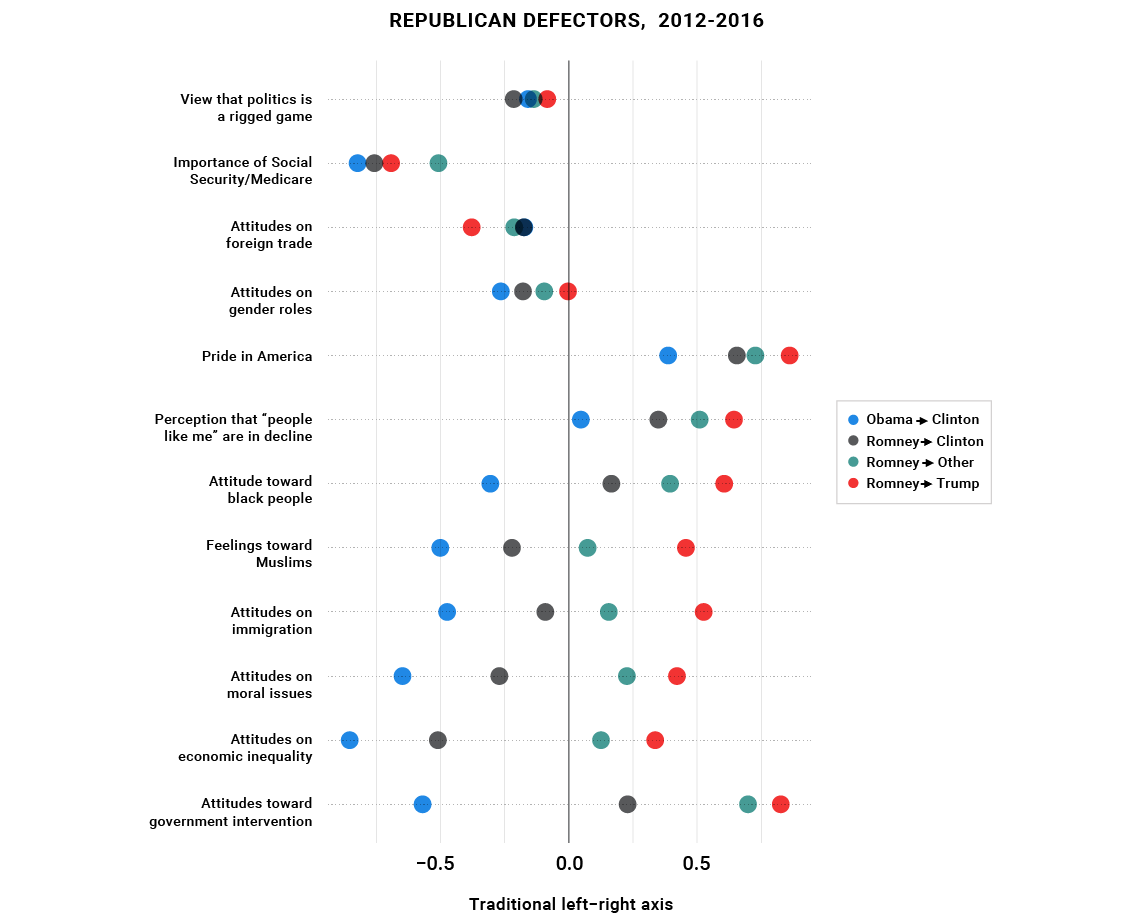
Drutman’s analysis confirms Ekins’ finding that the Trump general election coalition contains many voters who hold sharply different views on the economy and the role of government. Obama-Trump voters, for instance, are much more likely to hold liberal views regarding economic inequality and government intervention than Romney-Trump voters. Trump primary voters were also more negative about trade and held more liberal views on economic issues than did backers of either Marco Rubio or Ted Cruz. Strong Trump voters in general also expressed much stronger support for Social Security and Medicare than did any other cohort of Republican voters.
Drutman’s analysis suggests that it will be difficult for either party to maintain a durable coalition or gain adherents.
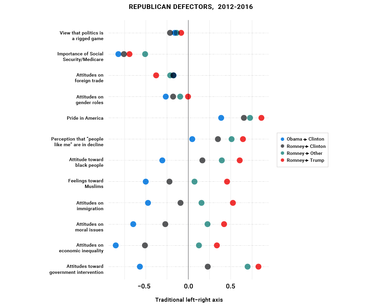
For Republicans, Drutman found that feelings toward minorities, immigration, and pride in America tend to unite Romney to Trump voters, Romney to Other voters, and Obama to Trump voters. (Ekins, on the other hand, found that most Trump voters held positive views of black people, Asians, and Hispanics. While the majority of Trump general election voters held negative views of Muslims and towards continued levels of illegal immigration, some Trump voters held more nuanced views of Muslims and supported increased legal immigration.) Other issues are either relatively unimportant or tend to divide one or more of these groups from one another.
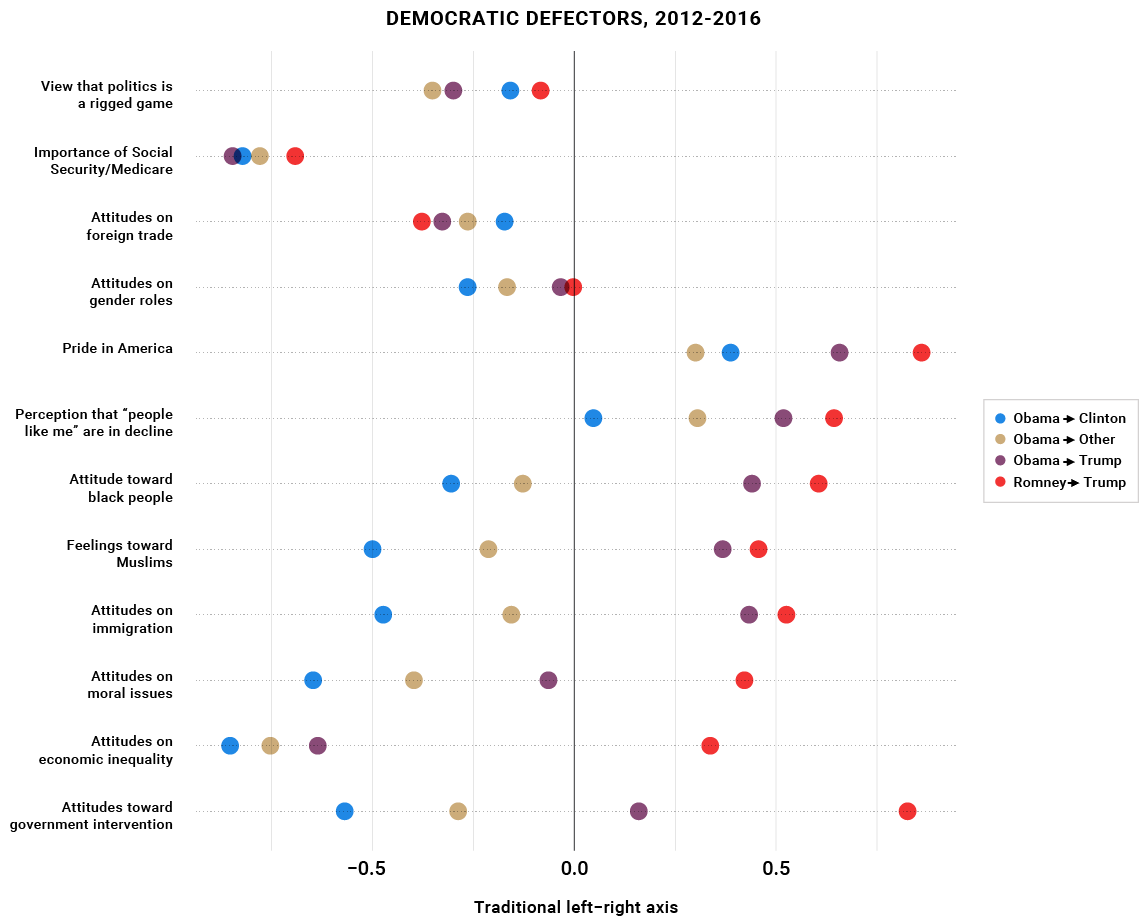
For Democrats, any group they want to attract to increase their support holds more centrist views on some set of issues. Voters who switched from supporting Obama or Romney to voting for a minor candidate in 2016, for instance, hold more centrist views on minorities, immigrants, and social issues than do Obama-Clinton backers. Obama-Trump voters hold much less liberal views on these issues than any of those three aforementioned groups, but align quite closely with Obama-to-Clinton voters on economic inequality and the importance of Social Security and Medicare. Their views on government economic intervention are also much more centrist than either party’s most dedicated supporters.
The Voter Study Group’s four initial papers show that while there is little evidence that our party system is preparing to disintegrate completely, efforts on the part of either party to create a stable majority will require robust debates on how we as a nation view American citizenship. Despite the country’s many disagreements on these issues and the policies needed to implement them, we believe that it is possible for all political actors to maintain a level of discourse that allows us to come together as Americans after elections and political decisions send our country in a particular direction.
The dataset this survey generated contains much more information than these initial inquiries could address. We invite public feedback on our work and are making this dataset available without charge to all researchers who wish to explore their own questions. We also will conduct other surveys in the coming months to explore new questions, and the data these surveys generate will also be made publicly available.


Subscribe to our mailing list for updates on new reports, survey data releases, and other upcoming events.
