
The Moderate Middle Is A Myth
FiveThirtyEight October 4, 2019
Economy, Immigration, Political Parties

Key Findings
As the Democratic presidential primary swings into full gear, voters and strategists are asking themselves what kind of campaign messaging can defeat President Donald Trump when it comes to economics and immigration. Can platforms that are progressive on economics and centrist on immigration win over working-class white voters? Or can the opposite approach (centrist on economics, progressive on immigration) win over higher-income professionals? Is it better to create a consistently progressive platform to energize base voters or run to the center? And, are there other winning issues a candidate should emphasize? Was healthcare a winning message in 2018? If so, should Democrats run on healthcare again?
Meanwhile, Republican strategists are wondering whether a replay of the immigration-heavy 2018 midterm election strategy can work in 2020. Or should they emphasize economics and run on the strength of the economy? Can they keep working-class white voters despite running traditional Republican economic policies?
Using data from the Democracy Fund Voter Study Group 2018 and 2019 VOTER Surveys (Views of the Electorate Research Survey), this report maps the electorate along two dimensions — economics and immigration. This offers new insights into how the electorate has shifted since the 2016 presidential election and how different issues and party strategies could impact the 2020 presidential election.(1)
(1) The 2018 VOTER Survey was fielded between April 5 and May 14, 2018. The 2019 VOTER Survey was fielded between November 17, 2018, and January 7, 2019.
This report focuses on two central issues of contemporary American partisan conflict: economics and immigration. Increasingly, Democrats are advocating a progressive economic agenda that promotes economic equality and are supportive of immigration. By contrast, Republicans continue to argue for limited government intervention in markets and for restrictions on immigration. But what do Americans think?
To analyze the electorate along these dimensions, I developed an economic index and an immigration index and gave each voter a score on both based on their answers to a mix of survey questions. The economic index is based on questions that discern attitudes about social welfare policies, inequality, taxation, and regulation. The immigration index is based on questions that discern attitudes about whether immigrants contribute or detract from American society and preferences for making it easier or harder for immigrants to come to America. Each index is constructed from the survey questions reported in the Appendix.
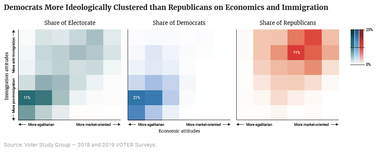
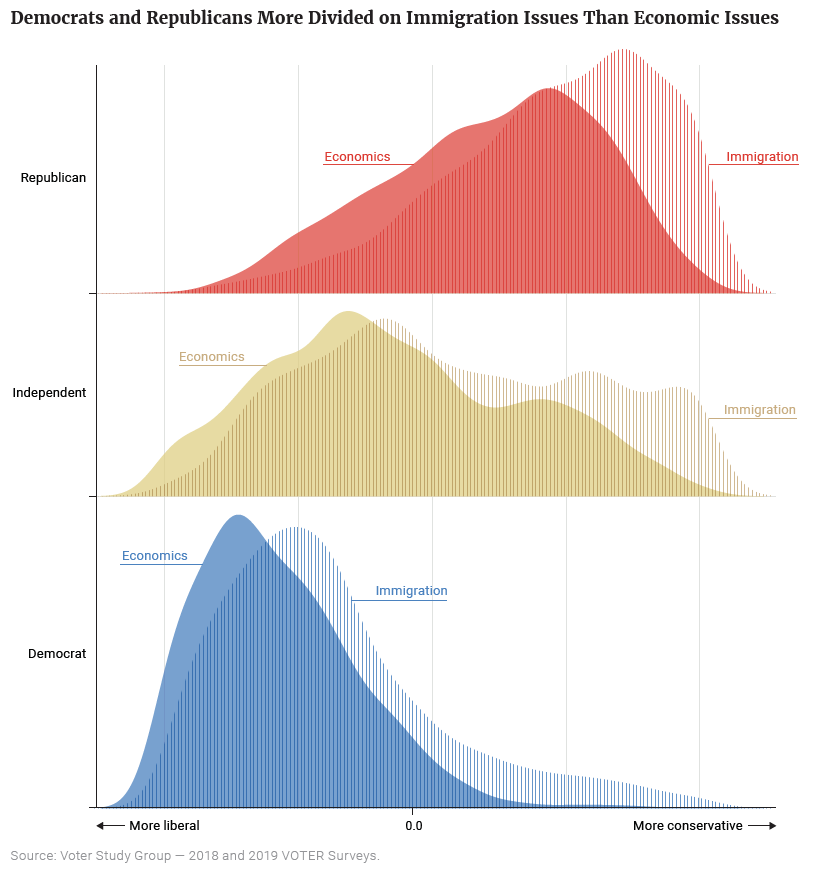
Economics and immigration separate Americans by party.(2) On economics, Republicans hold a broader range of views, whereas Democrats are more solidly concentrated on the left.(3) On immigration, the overall distribution is similar to economics, but Democrats, independents, and Republicans are all farther to the right. In fact, when it comes to immigration, more independents are on the right-hand side of the distribution (See Figure 1).
(2) For purposes of these figures and the rest of the report, Democrats include both self-identified Democrats and voters who lean Democratic (that is, voters who identify as independent, but when pressed say they usually vote for Democrats). Republicans include both self-identified Republicans and Republican leaners. Independents are respondents who refuse to say they consistently vote for a party even when pressed. Applying these criteria to the 2019 VOTER Survey, 48 percent of voters are Democrats, 37 percent are Republicans, and 15 percent are independents.
(3) While Democratic voters are relatively unified in support of progressive economic policies and in their explanations of inequality, Republicans are more divided. Lower-income Republicans are substantially more economically progressive than higher-income Republicans. About one in five Republicans hold economic views more in line with the Democratic Party than their own party. For more on this topic, see “On the Money: How Americans’ Views Define — and Defy — Party Lines.”
Figure 1

To analyze Americans across both dimensions, this report breaks them into groups based on their scores on the economic and immigration indexes. Along each dimension, respondents were broken into six groups, corresponding to their placement along each dimension. The three groups on the “left” all have scores below 0; the three groups on the right have scores above 0. The furthest “left” grouping has scores between -1 and -0.67, indicating that respondents consistently gave left-leaning answers on all the questions. The first “right” grouping has scores between 0.67 and 1, indicating that respondents gave right-leaning answers on all the questions.
Crossing these groupings against one another results in a total of 36 groups. The distribution of Americans into each of these cells is represented in the first panel of Figure 2 — with the darkest areas representing the groups where more Americans are clustered and the lighter areas representing groups where relatively few people are found.
About half (49 percent) of the electorate is consistently to the left on both dimensions, while a quarter (25 percent) are consistently to the right on both dimensions. That leaves just over a quarter of the electorate as cross pressured: those that either lean left on economics and right on immigration (19 percent), or those that lean right on economics and left on immigration (8 percent).(4) The second and third panels of Figure 2 display the distributions of Democrats and Republicans, respectively, and visually reinforces the extent to which Democrats are more concentrated than Republicans in their beliefs on these issues.
(4) For an analysis of the role of cross-pressured voters in deciding presidential elections, see D. Sunshine Hillygus, and Todd G. Shields, “The Persuadable Voter: Wedge Issues in Presidential Campaigns,” Princeton University Press, Princeton, NJ, 2009.
Figure 2
The 2x2 region in the bottom left of the “Share of Electorate” and “Share of Democrats” panels within Figure 2 contain almost a third (32 percent) of all Americans and 60 percent of Democrats, respectively. This is consistent with a broad leftward shift in both economic and immigration policy preferences among Democrats over the last few years.(5) This concentration of Americans in the lower left is already shaping the Democratic presidential primary in a number of ways. Because the bottom-left 1x1 cell has the highest educational attainment rate among Democrats (55 percent, as is shown in the next section), we should generally expect the Americans represented by this cell to have high turnout rate in the primaries, since education is strongly and positively correlated with political participation.(6)
Compared to Democrats, Republicans are more ideologically diverse. There are far fewer Republicans who hold the most consistently conservative positions on both economics and immigration (4 percent inhabit the upper-right 1x1 cell) than there are Democrats who hold the most consistently liberal views (15 percent inhabit the lower-left 1x1 cell). In addition,just 28 percent of Republicans are in the upper-right 2x2 region compared to 60 percent of Democrats in the lower-left 2x2 region. This is consistent with political science evidence showing that Republican voters, activists, and even lawmakers are more ideologically dispersed than Democrats.(7) On these two issues at least, Republicans appear to be the broader-tent coalition.
This analysis also finds a relatively small political center. The 2x2 region in the middle of the “Share of Electorate” panel accounts for only 13 percent of the electorate. This suggests that the center is a relatively lonely place to be in today’s politics. Though some potentially pivotal votes may still exist in the center, the mass of the electorate today is elsewhere.
(5) For an overview, see: David A. Graham, “How Far Have the Democrats Moved to the Left?,” The Atlantic, November 5, 2018, Accessed July 16, 2019. Available at: https://www.theatlantic.com/politics/archive/2018/11/democratic-voters-move-leftward-range-issues/574834/ or https://www.nytimes.com/2019/04/10/opinion/democratic-candidates-primaries.html.
(6) For evidence that primary voters are more highly educated than general election voters, see: John Sides, Chris Tausanovitch, Lynn Vavreck, and Christopher Warshaw, “On the Representativeness of Primary Electorates,” British Journal of Political Science, pp. 1–9, March 2018.
(7)On Republican voters and activists, see: Robert N. Lupton, William M. Myers, and Judd R. Thornton, “Party Animals: Asymmetric Ideological Constraint among Democratic and Republican Party Activists,” Political Research Quarterly, Volume 70, Issue 4, pp. 889–904, December 1, 2017. On members of Congress, see: Christopher Hare and Keith T. Poole, “The Polarization of Contemporary American Politics.” Polity, Volume 26, Issue 3, pp. 411–429, July 2014.
To better understand how Americans differ demographically by economic and immigration attitudes, I again break the electorate into 36 cells based on their position on the economic and immigration scales. Some of these cells are too sparsely populated to be meaningful — representing less than 1 percent of Americans — so I omit them from the analysis.
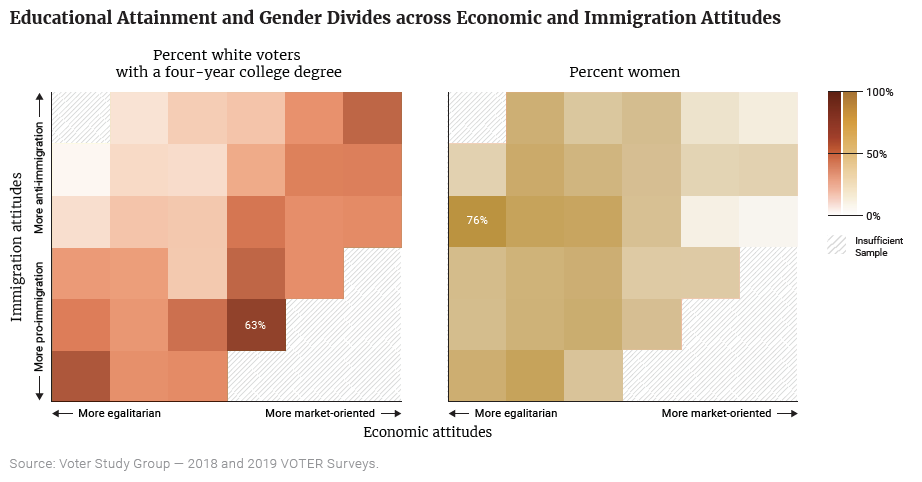
The first panel of Figure 3 shows the percentage of white Americans with a four-year college degree in each of the cells.(8) In this first panel, darker shades indicate cells where a higher percentage of respondents have four-year college degrees and lighter shades indicate the opposite. Overall, the most educated group is pro-immigration and economically conservative (located mid-lower right) with 63 percent of the white Americans represented having college degrees. This combination of ideas (socially liberal, fiscally conservative) is over-represented among political elites, yet that cell represents only about 1 percent of Americans. By contrast, college degrees are rarer among white Americans who are generally economically left but anti-immigration (i.e., the upper-left quadrant).
Consistent with much existing research, those Americans with ideologically consistent beliefs are also more likely to have higher levels of education.(9) They tend to follow politics more closely and often hold stronger views about issues; thus more education generally makes Americans more — not less — polarized. The consistently most conservative (upper-right 1x1 cell) and consistently liberal (lower-left 1x1 cell) respondents in this analysis are among the most educated — with 50 percent and 55 percent having college degrees, respectively.
(8) I limit the analysis here just to white voters, consistent with other analyses of the diploma divide.
(9)“A Wider Ideological Gap Between More and Less Educated Adults,” Pew Research Center, April 2016. Available at: https://www.people-press.org/2016/04/26/a-wider-ideological-gap-between-more-and-less-educated-adults/.
Figure 3

The second panel of Figure 3 shows the percentage of respondents who are women in each of these 36 groups. Darker shades indicate cells where a higher percentage of respondents are women and lighter shades indicate the opposite. Looking at Americans along these two dimensions reveals that the gender divide is sharper on economic issues than it is on the issue of immigration — with notably fewer women in the cells on the right side of the figure. Women make up less than a third (27 percent) of consistent, most conservative respondents.
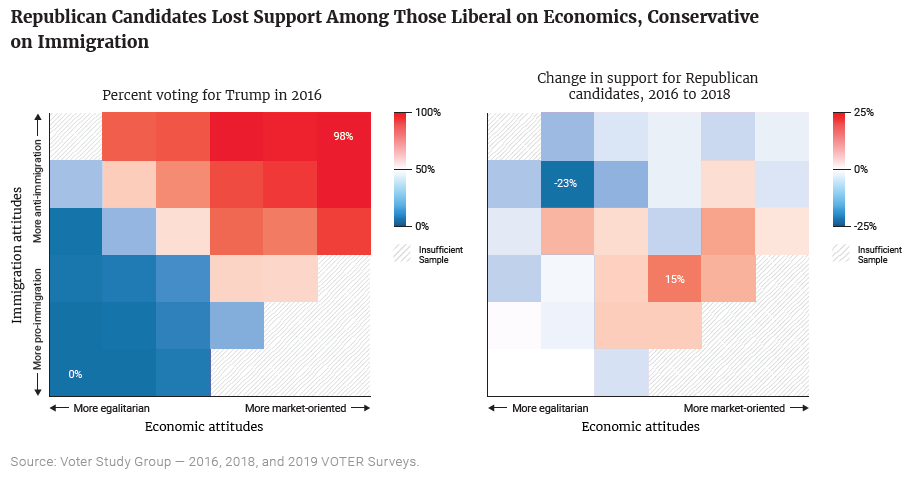
In the 2016 presidential election, the political divide was clear along the two dimensions of economics and immigration. The first panel of Figure 4 shows the percent of Americans who voted for Trump in 2016 — with red shading indicating Trump support over 50 percent and blue shading indicating the opposite (the darker the red, the higher the percentage that voted for Trump; the darker the blue, the smaller the percentage that voted for Trump).
Every cell that was on-balance “left” supported Clinton, and every cell that was on-balance “right” gave a majority to Trump.(10) Notably, Trump won a majority of the vote from respondents in all the cells that were equally balanced between “left” and “right.”(11)
(10) In this case, cells referred to as “on-balance” liberals or conservatives are determined by taking the average between their scores on the economic and immigration indexes. If average score for a respondent was below or above zero, that respondent would be considered “on-balance” liberal or “on-balance” conservative, respectively.
(11) These are admittedly small cells, so the margin of error is wide, about +/- 7–10 percentage points. As a result, we should be careful about over interpreting.
Figure 4

Compared to Trump’s performance in the 2016 presidential race, Republican candidates for Congress did worse in the 2018 midterms. To the extent that these different electoral results were driven by shifts in how Americans voted, those shifts were not evenly distributed across these economic and immigration attitudes. The second panel of Figure 4 shows the change in the percentage of voters in each cell who supported Trump in 2016, and the percentage who voted for a Republican for Congress in 2018. Blue cells reflect a shift towards Democrats; the darker the blue, the greater the shift. Red cells reflect a shift to Republicans; the darker the red, the greater the shift. White cells represent no change.
The biggest shifts generally were among cross-pressured voters. The largest shift away from Republicans and towards Democrats was among voters who were left on economics and right on immigration. By contrast, the largest shift towards Republicans were among voters who were left on immigration and right on economics. Those Americans in the lower-left 2x2 region and upper-right 2x2 region didn’t change their minds very much. Taken together, these patterns may suggest that pocketbook issues played a more important role in voter choice in 2018 than in 2016.
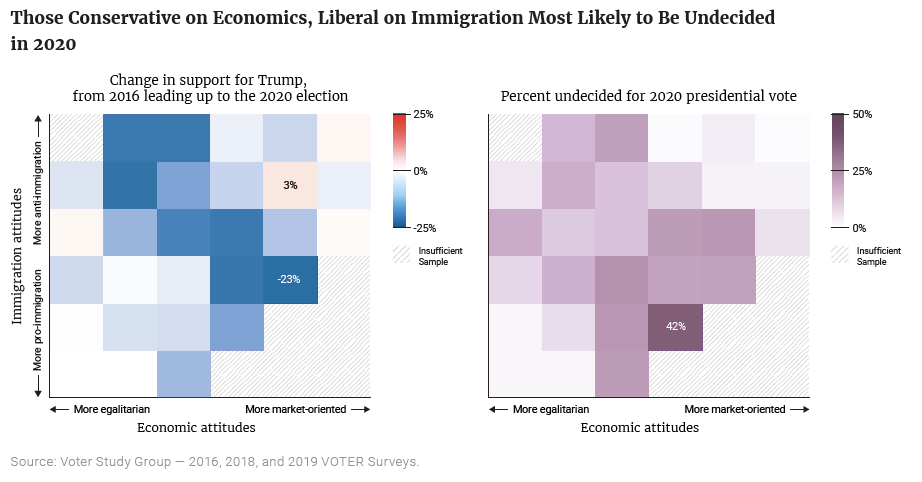
Things appear worse for Republicans as we look towards 2020. The 2019 VOTER Survey asked respondents to choose between Trump and a generic Democrat. Overall, the generic Democrat outpolls Trump 48 percent to 36 percent, with 11 percent undecided and 5 percent saying they would not vote. The first panel of Figure 5 shows the difference between the percentage of Americans who supported Trump in 2016 and the percentage who say they will definitely support Trump again in 2020. Again, blue reflects a shift towards a generic Democrat while red reflects a shift towards Trump relative to how these groups voted in 2016.
This matrix is almost entirely in shades of blue, which does not bode well for Trump. He is struggling among both groups of cross-pressured Americans and is only holding his support among fairly consistent conservatives. However, as the first panel of Figure 3 showed, the 3x3 region in the upper-right represents only about a quarter of Americans.
Figure 5

However, it is important to note that much of the decline in Trump support comes from cross-pressured Americans who were undecided directly after the 2018 midterms. While about one in 10 (11 percent) of respondents overall say they are undecided about whom they will vote for in 2020, this percentage varies considerably depending on placement on these two dimensions. The second panel of Figure 5 displays the percent of Americans in each cell that said they were undecided about who they would vote for in the 2020 presidential election. The most lower-left 1x1 cell and the most upper-right 1x1 cell have very few undecided Americans. By contrast, those cells with somewhat market-oriented, solidly pro-immigration views have the highest percentage of undecided Americans.
As both candidates and party leaders decide which issues to emphasize first in the primary and then the general election, the obvious question is which issues motivate which voters, since issue priorities vary across the electorate. I focus here on six potentially salient issues: immigration, crime, racial equality, healthcare, taxes, and the environment. Each of the panels in Figure 6 show the percent of Americans who say a given issue is “very important.” Once again, darker shades indicate a higher percentage while lighter shades indicate the opposite.
The issue of immigration varies quite substantially across the electorate (see the relevant panel in Figure 6). Generally, Americans who hold the most negative views of immigration are the most likely to see it as very important. This is doubly true if they also hold generally conservative views on economics.
Figure 6
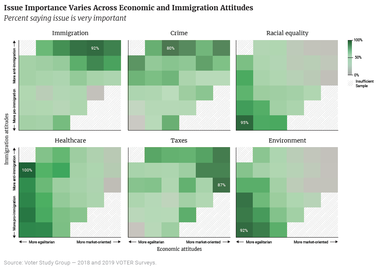
As shown in the second panel, the most anti-immigration portions of the American electorate are more likely to consider crime a very important issue. This is especially true among Americans who are more economically left and anti-immigrant. The far lower-left cell, home to the most consistently left-leaning Americans, is an outlier in not viewing crime as a very important issue.
When it comes to racial equality — a social issue Democrats have emphasized far more than Republicans — Americans in the far lower-left 1x1 cell in the third panel are also most likely to think that racial equality is a very important issue. This belief is shared by the majority of Americans who hold the most economically left views.
Collectively these three issues — immigration, crime, and racial equality — show different priorities among different parts of the electorate. Immigration is most important to those in the upper right (those with more market-oriented and more anti-immigration views), crime is most important to those in the upper left (economically left and anti-immigration), and racial equality is most important to those in the lower left (more economically left and more pro-immigration).
Moving on to economic issues, healthcare was the dominant economic issue in 2018 for Democrats, and they may choose to emphasize it again in 2020. As shown in the fourth panel, it is an issue that is important to a high percentage of Americans throughout the cross-pressured, upper-left part of the electorate — an area where Americans are more likely to be undecided — while also being an issue that does not motivate the most consistently conservative Americans.
The issue of taxes demonstrates an opposite pattern (see the fifth panel in Figure 6). It is much more of a priority among those that favor a more market-oriented economy than those who favor a more egalitarian economy, particularly among the part of the electorate that is also very pro-immigration. Similar to healthcare, the issue of taxes is important in many of the cross-pressured cells. It also marks another issue, like crime, where the relative unimportance of the issue to the most consistent progressives is at odds with the rest of the electorate.
While the environment is getting more attention, only those on the left — particularly the economic left — think it is important (see sixth panel). Consistently conservative Americans on both economics and immigration view the environment largely as an unimportant issue.
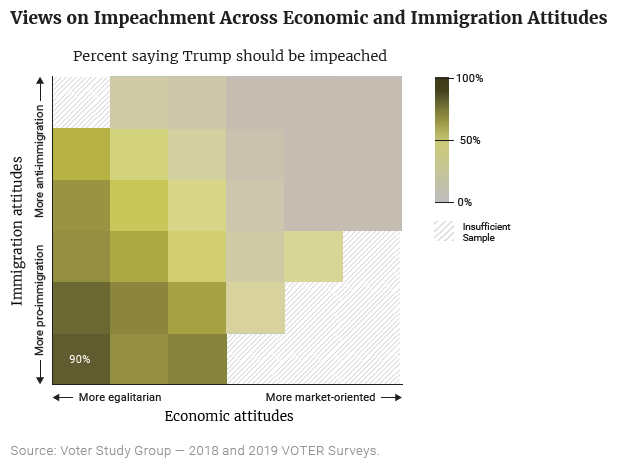
Finally, I also examine the issue of impeachment. The 2019 VOTER Survey (fielded in January, well before the release of the Mueller report on April 18, 2019) asked the following question: “Based on what you know right now, do you think that President Trump should be impeached and removed from office?” Slightly less than half of Americans said “yes” — including 28 percent who said “definitely yes” and 16 percent who said “probably yes.”
Figure 7 shows the percentage of Americans saying “probably yes” or “definitely yes” regarding impeachment. The partisan divide is as expected; the strongest support for impeachment comes from those with consistently liberal views, while support for impeachment fades closer to the political center. Conservatives, by contrast, are more consistent; support for impeachment is almost nonexistent throughout the cells in the upper-right quadrant.
Figure 7

Since 2016, Democrats have made some small but significant gains among economically-left and anti-immigration Americans, who appear to have been pivotal in helping Democrats in the 2018 midterms. At the same time, Democrats have struggled to win over economically conservative and pro-immigration Americans who were skeptical of Trump in 2016.
As in 2016, the 2020 presidential election is likely to hinge on cross-pressured voters, who are torn between one party that is more aligned with their attitudes on immigration and one party that is more aligned with their economic values. These Americans are not necessarily centrist. Many have off-center preferences on both economics and immigration — preferences that just don’t line up with either of the two major parties. Indeed, relatively few centrists exist in today’s very polarized electorate, at least on these two major issues now dominating American politics: economics and immigration.
And while this analysis suggests different paths forward for both parties to win in 2020, it also describes two very divided parties, particularly on the issue of immigration, and suggests continued partisan polarization for the immediate future.
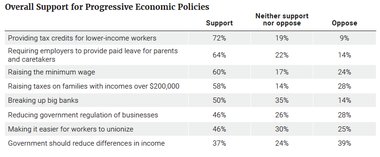
Although the survey asked respondents whether or not they strongly or somewhat support/oppose, I combined the responses for ease of interpretation.
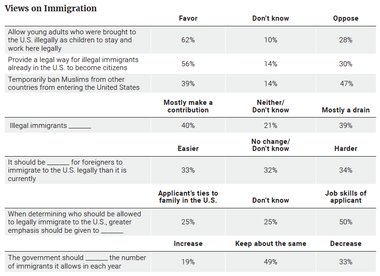
Immigration is obviously a complicated issue and different aspects of the immigration system engender varying levels of support.
The indexes are constructed simply: I weigh each question equally and treat the mid-point in the question’s scale as the mid-point for the question. The indexes are scaled from -1 to 1. Each question winds up effectively being coded from -1 (most liberal) to 1 (most conservative) after all transformations.
So, for example, in a five-option question, “Do you favor or oppose banning Muslims from other countries from entering the United States?” “Strongly favor” (the strongest right position) would be coded as 1, “Somewhat favor” would be coded as 0.5, “Don’t know” would be coded as 0, “Somewhat oppose” would be coded as -0.5, and “Strongly oppose” (the strongest left position) would be coded as -1.
For a question with only three options, the left position is coded as -1, the neutral position at 0, and the right position is coded as 1. For a question with four options, the strongly left position is coded as -1, and the softly left (usually “somewhat”) position is coded as -0.333. The softly right position is coded as 0.333, and the strongly right position is coded as 1.
On economic questions, the “left” position corresponds to anything involving more government regulation (spending on social programs, more government regulation, tax credits) or higher taxes, while the “right” position opposes new programs and supports less regulation.
On immigration, the “left” position corresponds to anything that makes it easier for immigrants to come to the U.S., become citizens, or expand in number. The “right” positions correspond to restricting the number of immigrants and making it harder for immigrants to become citizens.
I do not extract an underlying latent factor (though I’ve run a factor analysis to confirm that all questions in the separate indexes load on the same underlying, separate dimensions). Nor do I re-scale the indexes so that they have a mean of zero. Though I acknowledge theoretical reasons for doing one or both of these transformations, I believe the underlying questions should inform the analysis, and I’ve selected questions to represent a range of policies of varying popularity, all of which reflect political disagreements that correspond to existing political conflicts structuring current left-right conflict in the United States. Certainly, there is nothing canonical about these questions. Another researcher might choose to construct indexes out of different questions and generate different results. But given the current state of political conflict in American politics, I believe these questions are particularly informative. The indexes correspond closely to partisan voting patterns, which supports their validity.

Subscribe to our mailing list for updates on new reports, survey data releases, and other upcoming events.


