
Podcast: These Political Scientists Surveyed 500,000 Voters. Here Are Their Unnerving Conclusions.
John Sides, Lynn Vavreck
The New York Times - The Ezra Klein Show October 31, 2022
Key Findings
During the tumultuous 2016 election cycle, many observers of American politics noted the considerable amount of hostility and anger held by Republicans and Democrats when thinking about members of the other party. Political scientists have argued that the very personal nature of today’s partisan divide leaves little room for reconciling differences across party lines.(i) America is divided and becoming more so over time.(ii)
How much does this political landscape impact our long-term relationships with friends, families, and even romantic partners? Partisans claim to have very few friends in the opposing party.(iii) During the Thanksgiving holiday that followed the 2016 election, gatherings across the U.S. were reportedly shorter, specifically among families with mixed political views.(iv) The Cato Institute 2017 Free Speech and Tolerance Survey found that 61 percent of Clinton voters said it was hard to be friends with Trump voters, and 34 percent of Trump voters said it was hard to be friends with Clinton voters.(v) Pew Research Center has also found that 47 percent of Republicans would not consider dating a Clinton voter, while a majority of Democrats (71 percent) would not consider dating a Trump voter.(vi) How much does partisan antipathy influence a willingness to go even further and marry someone from the other party?
New data from the Democracy Fund Voter Study Group provides insight on opposite-party marriages in which individuals who identify with different parties are married. The VOTER Survey (Views of the Electorate Research Survey) is distinctive because it draws on a longstanding panel of respondents interviewed periodically since December 2011. The December 2019 VOTER Survey was conducted from November 22, 2019 to December 23, 2019. In both 2011 and 2019, married respondents were asked about the party affiliation of their spouse. Due to the nature of this survey, we can understand key aspects of opposite-party marriages today and track accompanying changes in individual behavior over time.
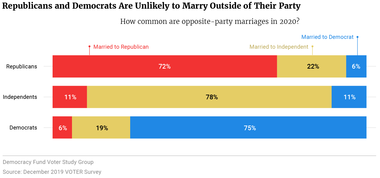
Previous research indicates that 9 percent to 10 percent of all marriages are between a Democrat and a Republican.(vii) However, those figures are based on voter registration records and estimates of both party identification; of which, cohabiting individuals are married. Using self-reported data on partisan views of both individuals and their spouses, we find that closer to 6 percent of respondents say their spouse identifies with the opposing party.(1) Most married people have spouses that share their party identification: 72 percent of Republicans, 75 percent of Democrats, and 78 percent of independents who are married have a spouse from the same party.(2)
(1) Political leaners who do not directly identify with a party, but say they overwhelmingly lean one way, are coded as partisans.
(2) For the purposes of this report, respondents identifying with a third party are excluded.
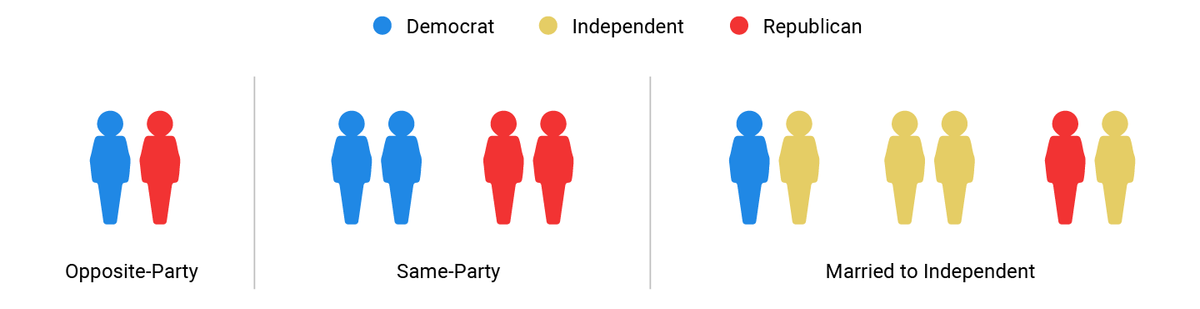
Figure 1
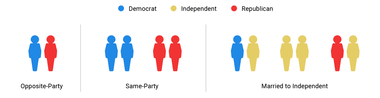
In order to understand opposite-party marriages and the political behavior associated with individuals in these relationships, we define three types of partisan marriages: opposite-party, same-party, and married to an independent. Opposite-party marriages are between one Democrat and one Republican. Same-party marriages are between two Democrats or two Republicans. The third type of partisan marriage includes circumstances where at least one person is an independent, including marriages between a Democrat and an independent, a Republican and an independent, or two independents.
Across various demographic characteristics, there are few differences between individuals in opposite-party marriages and other marriage types. Racial and ethnic groups are as likely to enter into a marriage with someone of the opposite party: The rate of opposite-party marriage is 5 percent among White couples, 4 percent among Black couples, 6 percent among Hispanic couples, and 6 percent among Asian couples.
There were also very few differences between politically attentive and politically inattentive Americans. About 84 percent of individuals in opposite-party marriages report following public affairs at least some or most of the time compared to 87 percent of other married people.
We also see few differences in opposite-party marriage rates across age groups, where between 5 percent and 8 percent of each age group are married to opposing partisans. We expected to find that younger people would be less likely to marry someone from an opposing political party due to political socialization during a time of stark differences between the parties; however, these differences do not appear to be substantial.
Figure 2
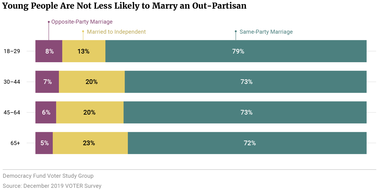
One reason why we don’t see large age differences could be that 18- to 29-year-olds are less likely to be married (25 percent married) compared with older adults (59 percent married among those ages 30 and above). Additionally, younger people are more likely to identify as independents and attach themselves to a political party at a later age — 20 percent of respondents under 30 years old compared to only 14 percent of respondents 30 years old or older identify as independents.
Individuals in opposite-party marriages sort along partisan and ideological dimensions in much the same ways that others do, meaning that they identify with the most common combination of partisan and ideological labels: Democrats identify as liberals and Republicans identify as conservatives. Of interest given the upcoming presidential election, 6 percent of all marriages in 2020 battleground states are opposite-party marriages, compared to 5 percent in non-battleground states. The difference here is not statistically significant.
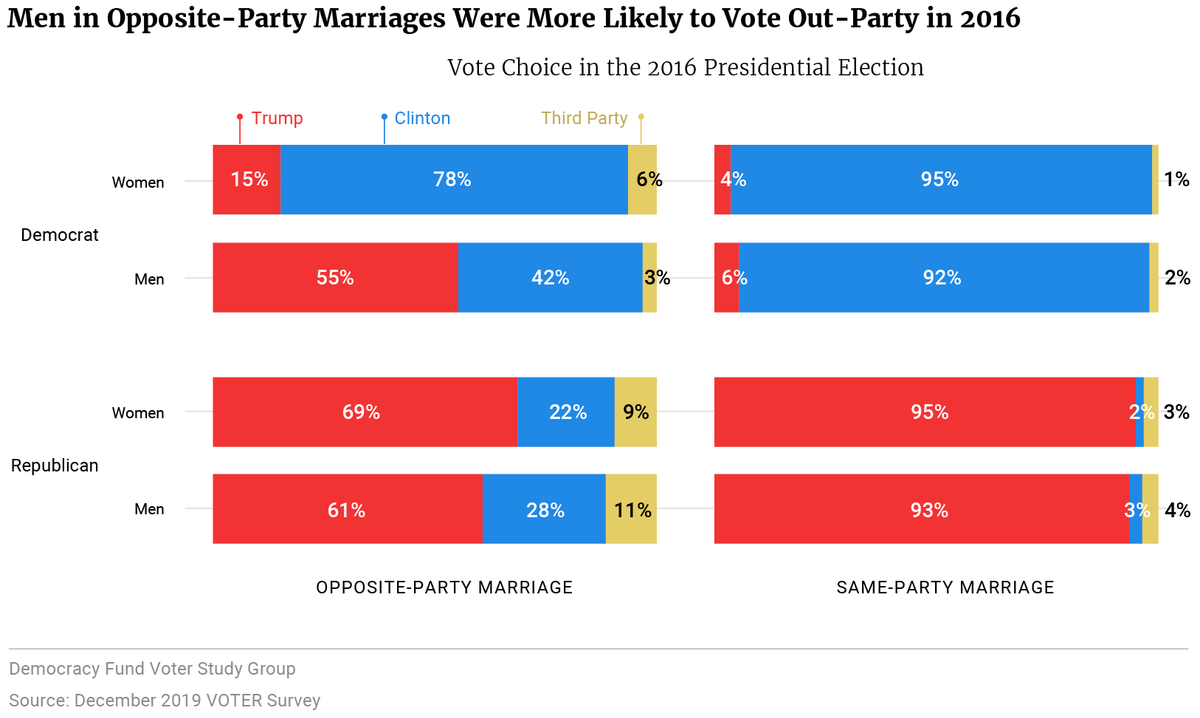
Most voters voted along party lines in 2016. Just 9 percent of Democrats voted for Trump and 7 percent of Republicans voted for Clinton — only a slight increase over the share of out-party voting in 2012 according to National exit polls.(viii)
Overwhelming majorities of those married to co-partisans voted for their party’s presidential candidate. Rates of defection for Democratic men (6 percent) and women (4 percent) as well as Republican men (3 percent) and women (2 percent) who were married to co-partisans were lower than the average for their respective partisan groups.
Figure 3
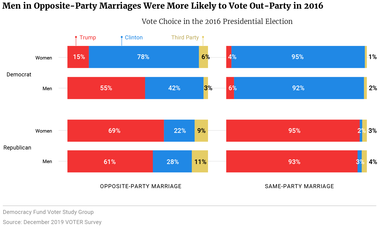
The story is different for individuals in opposite-party marriages. Both men and women in opposite-party marriages were more likely to vote out-party or third-party than those in same-party marriages. About a third of Republicans voted for Clinton (25 percent) or a third-party candidate (10 percent) when their spouse was a Democrat. This trend was similar for both Republican men and women.
Democrats married to Republicans were a different story. Specifically, Democratic men were more likely to defect than were Democratic women. More than half (55 percent) of Democratic men married to a Republican voted for Trump while only 15 percent of Democratic women married to a Republican voted for Trump.(3)
In short, voters are more willing to vote across party lines when their spouse identifies with the other party. Democratic men appear especially susceptible to this pattern, voting for Trump far more than Democratic women who were married to Republicans. It appears that disdain for Clinton may have been powerful in persuading Democrats, or at least the Democrats who were married to Trump-voting women (92 percent of Democratic men married to Democratic women voted for Clinton in 2016). However, the trend holds in 2012, when among Democratic men married to Republican women, 60 percent reported voting for Romney.
Looking to the upcoming presidential election, we see similar intentions to vote out-party depending on partisan marriage type in 2020. In the 2019 November-December wave of the VOTER Survey, respondents were asked their likely choice in the upcoming presidential election between Donald Trump and the Democratic candidate. Among both Democratic and Republican respondents with a spouse from the other party, about 28 percent said they would vote for the other party’s candidate in November.
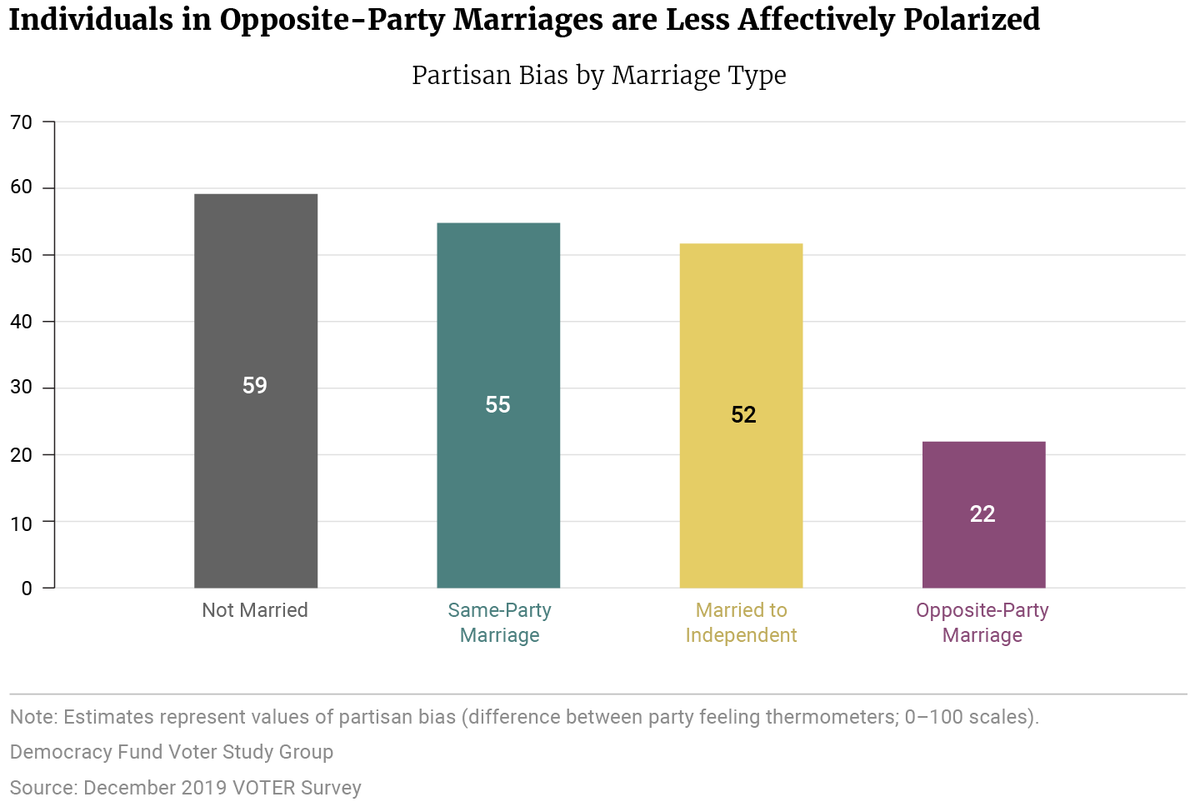
This level of cross-party voting is uncommon in today’s politics. A more common narrative in American politics focuses on the pervasiveness of polarization. One type of polarization, affective polarization, describes the animosity and distrust between Democrats and Republicans.(ix) Political scientists measure affective polarization through party feeling thermometers that gauge how respondents feel toward each party on a scale of 0 to 100, with 0 representing the least favorable, 100 being the most favorable, and 50 being the middle point. Partisan bias is measured as the numeric value of a person’s feelings toward the opposing party subtracted from the value of their feelings toward their own party. Positive scores indicate bias in favor of one’s own party.
The figure below presents the average level of partisan bias among each marriage type including individuals who are unmarried.(4) Importantly, every group is biased toward their own party. What stands out is that people in opposite-party marriages are far less biased. Unmarried people (55 points) and individuals married to co-partisans (59 points) or independents (52 points) are all between 50 to 60 points biased toward their own party. The only group that is different is respondents in opposite-party marriages, who are only 22 points biased toward their own party, less than half of the average for all other groups in the survey. These results stand even when controlling for partisan-ideological sorting.
(3) As we show in the next section, there is a substantial amount of partisan switching by individuals in opposite-party marriages. Here, we use respondent party identification from 2019 to accurately reflect the partisan marriage measure and the 2016 post-presidential election survey question for vote choice. It is possible that some respondents appear to have voted out-party, while actually identifying with a different party in 2016.
(4) In this case, respondents who identified as independent are not included in the married to independent category as they do not identify with either party and therefore have no traditional in-party.
Figure 4

Based on levels of affective polarization and vote choice in the 2016 election, it is clear that in an era of rampant partisanship and polarization, members of opposite-party marriages are more tolerant of the opposing party. They are more willing to defect from voting for their party’s nominee in presidential elections and exhibit lower levels of partisan bias. Marriage to an out-partisan may reduce negative partisan animosity, or the individuals who decide to marry someone from the other party may have had lower partisan animosity in the first place.
Does being married to an out-partisan increase marital tensions over time? Given that individuals in opposite-party marriages are about as interested in public affairs and have similar levels of partisan strength as other married individuals, it’s reasonable to assume that being married to the other team may wear on the relationship over time.
Using data from the VOTER Survey panel between 2011 and 2019, we examine how likely it is that individuals who started out in opposite-party marriages reported that they were still in opposite-party marriages eight years later. We obtain these values by calculating the percentage of respondents who reported being married in 2011 and divorced in 2019.(5)
Only 2 percent of respondents in opposite-party marriages report that they got divorced since 2011. This is, if anything, a slightly lower rate of divorce than for those who started off in same-party marriages (3 percent) and for respondents married to an independent (3 percent). These findings have limitations as this survey covers only an eight-year period, with no record of when marriages begin or end. The divorce rate reflected in this data may be lower than in reality. For example, it is possible for respondents to get divorced and remarried between survey years. Despite changes to their marital status, these individuals would appear to be continuously married in the data.
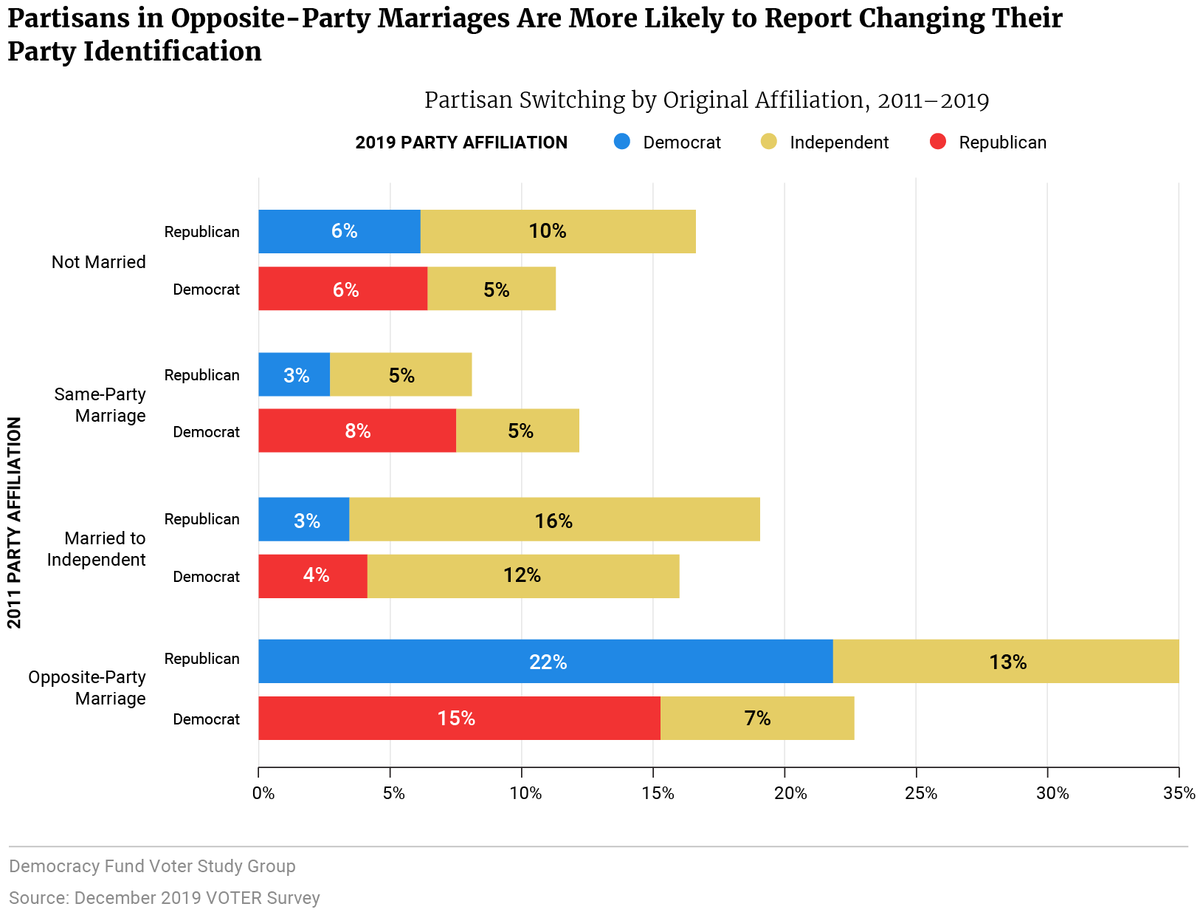
Although marital attachments seem to last, opposite-party marriages do appear to wear on an individual’s partisan attachments. Decades of research on American politics shows that, once formed, party identification remains relatively constant over time. The figure below shows the percentage of respondents who reported switching their party identification between 2011 and 2019. Survey respondents are separated by their marriage typology and party identification in 2011.(6)
(5) In the December 2019 VOTER Survey, respondents were given the following possible responses for their marital status: married, separated, divorced, widowed, never married or domestic/civil partnership. Respondents who reported being divorced count towards our estimates.
(6) Respondents who identified as independent in 2011 (not shown here) are the most likely to indicate changing their party identification by 2019. Forty-eight percent of unmarried independents and 46 percent of independents married to other independents changed their party during this period.
Figure 5

Overall, most respondents kept their partisanship the same over the eight-year period we examined. However, individuals in opposite-party marriages were far more likely to switch to identifying with the other party as compared to other married or unmarried respondents. Between 2011 and 2019, 15 percent of Democrats married to Republicans reported changing their party identification to Republican while 7 percent changed to independent. Among Republicans married to Democrats, 22 percent reported changing their party identification to Democratic — the largest opposite party shift of any group examined here. An additional 13 percent of these Republicans began affiliating as an independent.
Altogether, about 28 percent of respondents in opposite-party marriages in 2011 reported changing their party identification by 2019. Respondents married to independents were the next most likely to change, mostly toward identifying as independent. Unmarried respondents and those married within their party were far less likely to report changing their identification over the eight-year period.
Our analysis bears out two important conclusions. First, individuals who marry outside of their party are not less political than people who marry within their party. They are not less interested in politics and, on average, they are sorted similarly along partisan and ideological dimensions. Surprisingly, young people are about as likely to enter into marriage with an opposing partisan, when compared to other age groups.
Second, members of opposite-party marriages are more open-minded toward the parties. In a time where about 90 percent of voters cast a vote for their party’s nominee for president, members of opposite-party marriages are the most likely to vote outside of their party. Being married to someone who identifies with the opposing party appears to bring about an understanding or an acceptance for difference that enables these people to move beyond partisan labels on the ballot. Despite rising levels of polarization over the last few decades, these individuals are the most likely group to have lower levels of affective polarization.
With less than three months until the presidential election, many commentators are speculating over the percentage of Republicans who will support Joe Biden. Well-funded efforts like the Lincoln Project, for example, focus on persuading Republicans who feel alienated by Trump’s policy stances or behavior while in office to consider alternatives. Still, persuasion is difficult in today’s polarized environment. Encouraging opposite-party marriages may not be a viable electoral strategy, but it does reveal how close, personal contact with members of the other party can bridge the partisan divide.
This brief was updated on August 14, 2020 to resolve errors related to survey weighting.


Subscribe to our mailing list for updates on new reports, survey data releases, and other upcoming events.
