
American Muslim women don't need you to save them from Islam. They need your respect.
Dalia Mogahed
USA Today August 10, 2018
Key Findings
The 2016 presidential campaign and the first year of the Trump administration brought a renewed focus on Muslim populations both inside and outside the United States. As a candidate, President Trump suggested that large numbers of Syrian refugees were terrorists and falsely claimed that thousands of Muslims in New Jersey cheered the Sept. 11 attacks. He proposed a national database to register Muslims, enhanced surveillance of mosques in the United States, and a ban on Muslims entering the United States.
President Trump was rebuked by politicians from across the political spectrum. During the primary campaign, Governor Jeb Bush said, “You talk about closing mosques, you talk about registering people — that’s just wrong.” Speaker of the House Paul Ryan said that the Muslim ban violated the Constitution and was “not who we are as a party.” Trump’s future running mate and Vice President Mike Pence tweeted: “Calls to ban Muslims from entering the U.S. are offensive and unconstitutional.”
Nevertheless, as president, Trump has sought to carry out many of these policies — seeking to impose restrictions on refugees coming to the United States and on travelers to the U.S. from certain Muslim-majority countries. A Department of Homeland Security proposal called for long-term surveillance of Muslims in the United States who fit a certain demographic profile.(i)
Trump has also drawn attention to anti-Muslim sentiments from far-right groups, such as by re-tweeting videos shared by the British group Britain First that purported to depict acts of Muslim violence. This led to widespread condemnation within Great Britain, including by Prime Minister Theresa May. Trump eventually apologized.
More recently, however, Trump’s selection of John Bolton for National Security Advisor and nomination of Mike Pompeo for Secretary of State attracted fresh concern because of Bolton’s and Pompeo’s previous statements about Muslims. A recently published investigation by two Buzzfeed reporters also identified many state and local policymakers, mostly Republicans, who have also made harsh comments about Muslims.(ii)
These and other events make it even more important to understand how Americans view Muslims and especially Muslims living in the United States, who are projected to double as a share of the U.S. population by 2050.(iii) Unique data from the July 2017 wave of the VOTER Survey (Views of the Electoral Research Survey), as well as other surveys, reveal that Americans’ attitudes toward Muslims in the U.S. are distinctly unfavorable. Although Americans ascribe some positive traits to most Muslims — such as caring about their families — they ascribe negative traits to many Muslims as well. This negative stereotyping of Muslim Americans is more prevalent than stereotyping of Christians. It is also quite out-of-step with the actual attitudes and characteristics of Muslim Americans.
Unfavorable views of Muslim Americans are more prevalent among Republicans and conservatives, as well as among people with a more circumscribed view of American identity — such as those who believe that being Christian is important to being American, or those who believe that ethnic diversity is harming the United States. Less favorable views of Muslims are also tied to less favorable views of many other minority groups, demonstrating how prejudicial feelings are part of a broader “syndrome” that includes not only Muslims but also Jews, black people, Hispanics, and gays and lesbians.
Finally, there is substantial support for policies targeting Muslims — including restrictions on travel to the U.S. from Muslim-majority countries, surveillance of mosques in the U.S., and screenings at airports. Nearly one-in-five Americans would even deny Muslims who
are U.S. citizens the right to vote. The civil rights and liberties of Muslim Americans have a tenuous status in American public opinion.
Thus, the social equality of Muslims faces significant hurdles. These hurdles will be even harder to overcome given our present political discourse, when harsh characterizations of Muslims come not only from the fringes of American political life, but from elected officeholders at all levels of government.
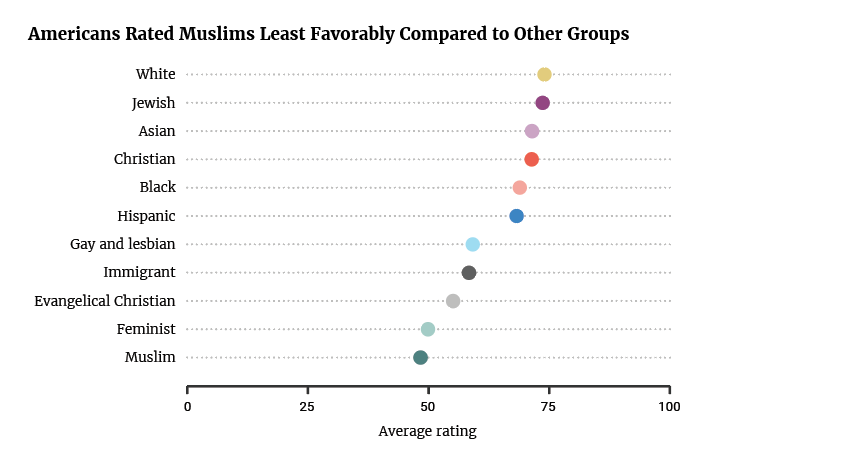
In earlier surveys, Americans rated Muslims relatively unfavorably compared to other groups.(iv) This was true in the VOTER Survey as well. Respondents rated a variety of demographic groups on a 0 to 100 scale, where 100 indicates the most favorable rating.(1)
(1)Only 13 of 5,000 respondents to this survey indicated that they were Muslim. We focus on non-Muslims’ attitudes toward Muslims and thus do not include them in any analysis presented here.
Figure 1
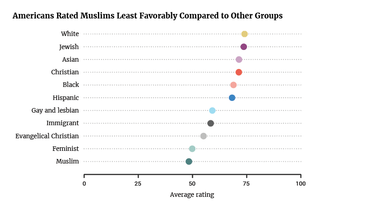
Among these groups, the average rating for Muslims was the lowest (48), similar to the rating of feminists. Other ethnic and religious groups were rated more favorably. For example, the average rating of Christians was 71 and the average rating of Jews was 74. The average rating of evangelical Christians was 55.
This does not make Muslims the least popular group in American society. Earlier surveys show, for example, that Americans evaluated “illegal immigrants” less favorably. And even in the VOTER Survey, some political groups were evaluated similarly or less favorably: the average for Democrats was 48 and the average for Republicans was 44.(2) Nevertheless, Muslims elicit cooler feelings than most other major ethnic and religious groups.
(2) The July 2017 VOTER Survey also asked about the alt-right, whose average rating was even lower (31), although a substantial percentage of respondents (25 percent) were not familiar enough with the alt-right as a group to rate it. For data on feelings toward illegal immigrants, see: John Sides andKim Gross, “Stereotypes of Muslims and Support for the War on Terror,” Journal of Politics, Volume 75, Issue 3, pp. 583–598, July 2013. Available at:https://home.gwu.edu/~jsides/muslims.pdf.
These overall views of Muslims conceal a more varied set of perceptions. Earlier research has shown, for example, that Americans rate Muslims less favorably on dimensions like trustworthiness and a propensity to violence than they do on dimensions related to intelligence or work ethic.(v) This research also found that Americans see Muslims and Muslim Americans similarly, suggesting that “Americanness” alone does not lead to more positive views.
The VOTER Survey sought to build on this research in two respects. First, the survey queried respondents for their views on “Muslims living in the United States” — so as to distinguish them from Muslims living in other countries. For simplicity’s sake, we will refer to this group as “Muslim Americans,” although not all of them may be U.S. citizens.
Second, rather than asking respondents to rate Muslim Americans on a scale capturing a specific trait, the survey asked respondents what percent of Muslims living in the United States are described by a specific statement. There were 10 statements in all (five positive and five negative), which were presented in random order. For each statement, respondents moved a slider along a continuum from 0 to 100 percent. The continuum had verbal labels at 0 percent (“none”), 50 percent (“half”), and 100 percent (“all”). The 10 statements were:
This same battery of items was also asked about Christians living in the United States in a different YouGov survey conducted January 9–18, 2018. Although this survey was conducted among a separate cross-section of respondents — preventing comparisons of what the same respondents thought about Muslims and Christians — having both sets of items allows us to compare overall perceptions of each group. There are other conceivable and relevant comparisons besides Christians, to be sure. But Christians are a useful comparison because they have long been the majority religious group in the United States.
The goal of these items is to capture the extent of stereotyping — namely, how broadly respondents apply various characterizations to the population of Muslims and Christians in the United States. At the same time, responses to these questions may reflect factors other than stereotyping. For example, people routinely overestimate the prevalence of minority groups such as Jews, black people, Hispanics, the foreign-born, gays and lesbians, people receiving government assistance, and often by a significant amount. At the same time, they
underestimate the prevalence of majority populations, like white people or Christians.(vi) Thus, to the extent that these stereotype items are characterizing small groups of people — such as those willing to commit an act of terrorism — estimates of their prevalence should be larger than in reality.
Moreover, people tend to exaggerate the prevalence of low-probability events, especially when examples of those events routinely generate headlines. For years, the majority of Americans has said that the crime rate is increasing when the opposite is true.(vii) People also tend to exaggerate the likelihood of terrorism and other rare events while underestimating the dangers posed by ordinary activities, such as driving.(viii)
The additional challenge in asking about social groups is that respondents may not “use” the 0 to 100 percent scale in the same fashion. Individual respondents differ in their willingness to express warmer or cooler feelings about any group. One way to mitigate this is “benchmarking,” or providing respondents a range of “reasonable” answers that help anchor their estimates. For example, if you were to ask respondents to estimate the U.S. unemployment rate, you might tell them its historical minimum and maximum. Unfortunately, it is harder to know what the appropriate benchmarks for these stereotype items are.(ix)
The upshot is that responses to these items, like many kinds of survey questions, will reflect more than what the questions appear to be measuring on their face. For this reason, we focus less on the exact estimates themselves — such as what percent of Muslims or Christians are perceived to contribute to the economy — and more on relative differences. The key questions are:
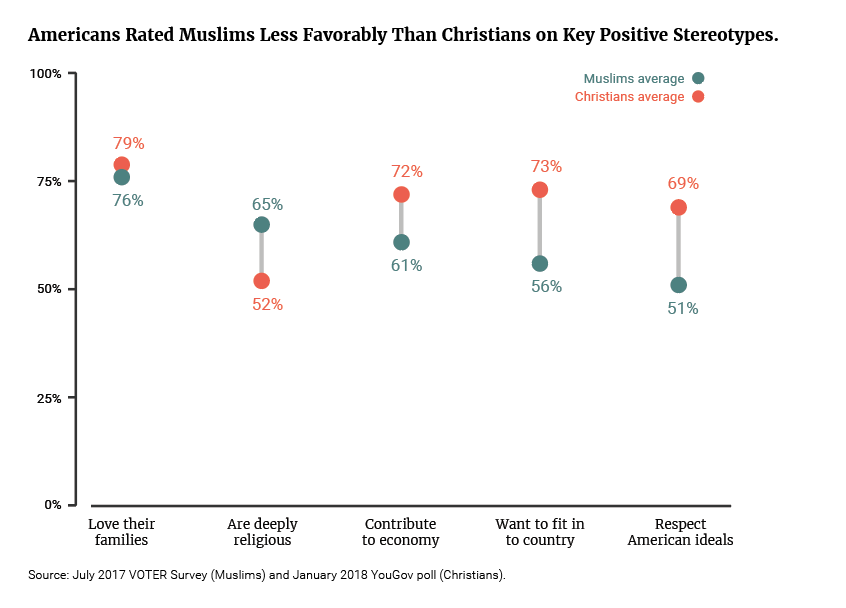
Figures 2 and 3 present the distribution of responses to the positive and negative stereotype questions, respectively, for both Muslims and Christians. The items are sorted from top to bottom by the average percentage of Muslims that respondents said was described by each statement.
As is common in survey questions with many scale points, respondents tended to clump at salient numbers, usually multiples of 25 (25 percent, 50 percent, 75 percent, 100 percent). Respondents also tended not to use the most extreme values of the scale: at most, roughly a quarter of respondents chose exactly 0 or 100 percent on any item, for either Muslims or Christians. This has the effect of pulling averages toward “the middle,” meaning that positive stereotypes will be perceived as describing fewer Muslims or Christians, while negative stereotypes will be perceived as describing more.
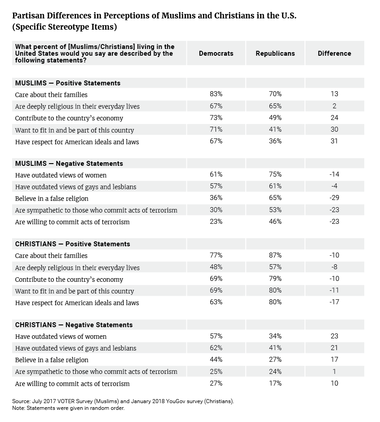
Of the five positive stereotypes, respondents attributed “love their families” to the largest percentages of both Muslim Americans (76 percent) and Christians (79 percent) and did not differentiate them on this dimension. Respondents did tend to see Muslims as more religious than Christians: respondents said that 65 percent of Muslims were deeply religious, compared to 52 percent of Christians.
There were larger, and more politically consequential, gaps in responses to the three other items. On average, respondents believed that a larger percentage of Christians than Muslims contributed to the economy (72 percent vs. 61 percent), wanted to fit in and be part of the country (73 percent vs. 56 percent), and respected American ideals and laws (69 percent vs. 51 percent). Respondents appeared more skeptical about the ability of Muslim Americans to integrate into American society and abide by American norms than their ability to make an economic contribution. This greater concern about the “cultural fit” of Muslims parallels findings from many studies of opinions toward immigrants and ethnic minorities.(x)
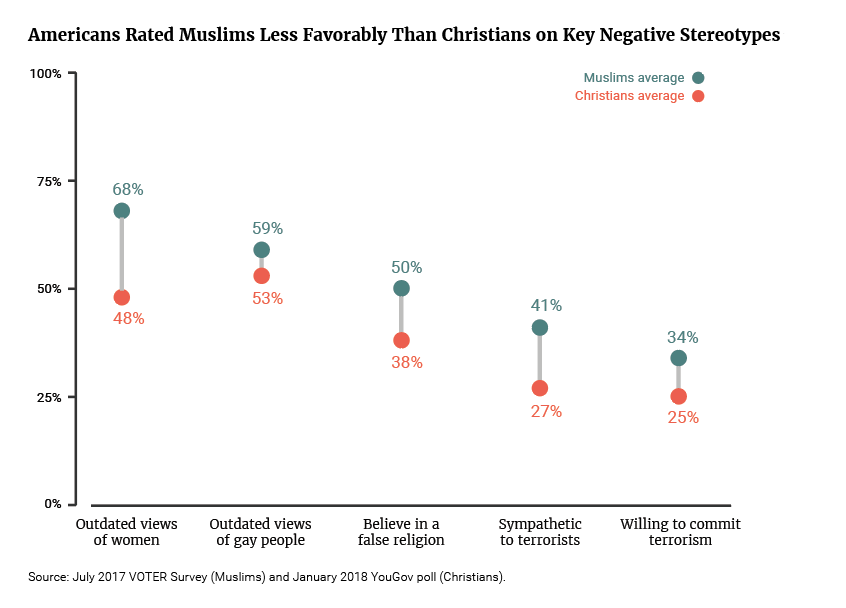
The most prevalent negative stereotype of Muslim Americans was that they have outdated views of women (68 percent were perceived this way) and gays and lesbians (59 percent).(3) Respondents believed that fewer Christians had such views. But the difference in perceptions of Muslims and Christians was larger for women (67 percent vs. 48 percent) than gays and lesbians (59 percent vs. 53 percent). Concerns about the place of women within Islam appear distinctive. There was a similarly sized divergence in perceptions of how many Muslims or Christians believed in a “false religion.” This likely reflects a broader acceptance of Christianity than Islam.
(3)Other polls have produced similar results. In a 2009 Gallup study, 78 percent of Americans said that “most Muslims around the world” were not accepting of homosexuals and 81 percent disagreed with the statement that “most Muslims believe women and men should have equal rights” (Gallup/The Coexist Foundation. 2009. Religious Perceptions in America.). Concerns about Muslims’ treatment of women also emerge in studies of public opinion outside the United States. For one study of Dutch public opinion, see Sniderman and Hagendoorn.
Figure 2

Perceptions of potential physical threat were less prevalent than other negative stereotypes overall, but more prevalent for Muslims than Christians.(4) It is especially important not to take the literal responses at face value — i.e., that on average, respondents believed that 41 percent of Muslims and 27 percent of Christians were sympathetic to those who commit terrorist acts. In the absolute, those estimates may partly reflect the cognitive biases we have discussed previously. More important are the relative differences — especially the extent to which Muslims were perceived as more sympathetic or prone to violent acts.
(4) In the 2009 Gallup study, only 27 percent of Americans believed that Muslims “want peace.”
Figure 3

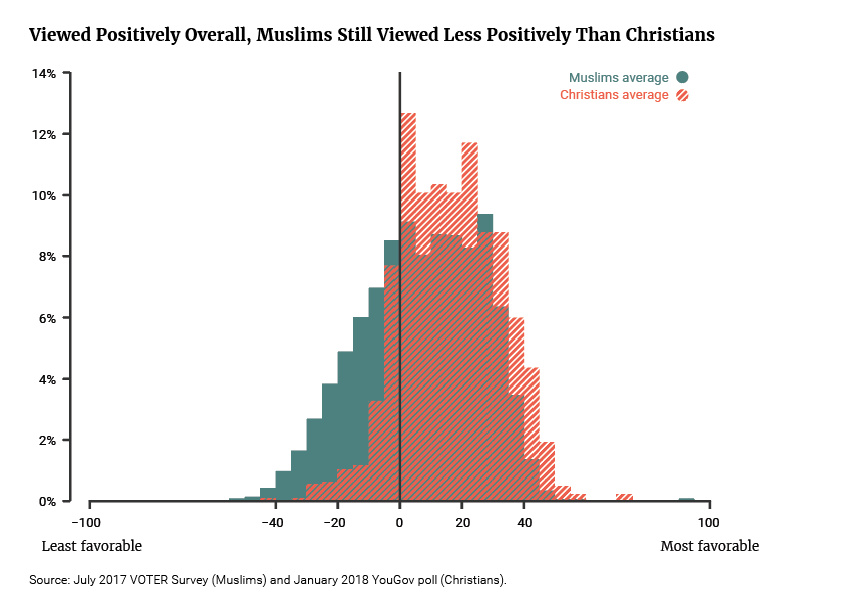
Taken together, these results suggest two important conclusions. First, Americans’ perceptions of Muslims continue to be less positive than perceptions of Christians. This is not a surprising finding, and it comports with prior surveys and research. To summarize this finding, we averaged the 10 questions to capture the distribution of stereotypes on a -100 to +100 scale (Figure 4).(6) A person who scored -100, for example, would have said that no Muslims or Christians in the United States were described by each of the five positive traits, but 100 percent were described by each of the five negative traits. A person who scored +100 would have the opposite pattern.
(5) In Figure 3, views of other social groups were measured on zero to 100 scales in the December 2011 wave of the VOTER Survey. The quantities depicted are smoothed averages of the composite Muslim stereotyping scale.
(6) The reliability of the scale is quite high (Cronbach’s alpha = 0.86). A factor analysis showed that these traits loaded on a single dimension, and a predicted score based on the factor analysis correlated quite highly (r = 0.97) with the scale presented in Figure 2.
Figure 4
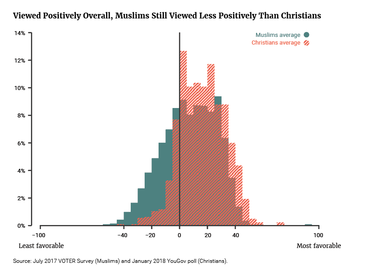
Most respondents do not score at the extremes of the scale, but between roughly -40 and +40. In the Muslim stereotypes scale, the average respondent was located at +6, which means that, on average, respondents ascribed positive traits to a slightly higher fraction of Muslims than they ascribed negative traits. About 36 percent of respondents ascribed negative traits to more Muslims than they did positive traits (scores below zero). The scale of the Christian stereotype items showed a more positive view of Christians, with the average respondent located at +16. Only 14 percent of respondents ascribed negative traits to more Christians than they did positive traits.
Second, concerns about Muslims’ “cultural fit” are particularly prevalent. They are more prevalent than concerns about the threat of terrorist acts perpetrated by Muslims. They are also more prevalent than concerns about the cultural fit of Christians. Many respondents believe that substantial percentages of Muslims do not want to be part of this country or respect its institutions and laws. The perception that many Muslims have outdated views of women or believe in a false religion could also reflect the concern that Muslims are just “not like us.”
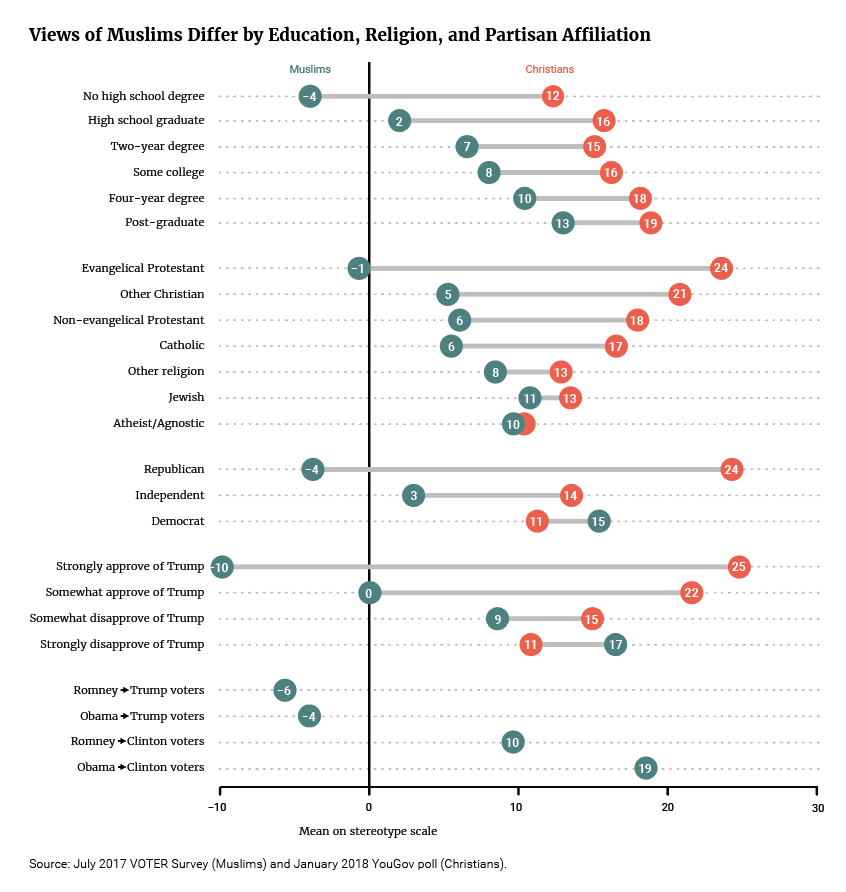
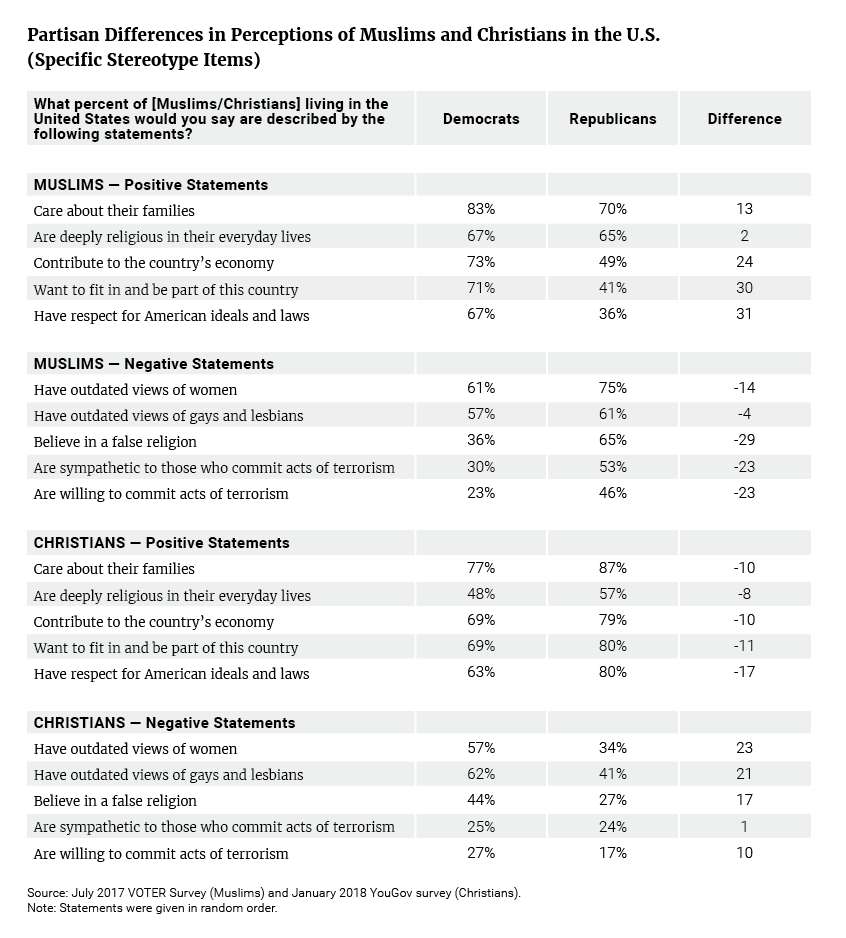
The extent of Muslim and Christian stereotyping depends, to a great extent, on demographic and political attributes. Most notably, overall stereotyping of Muslims and Christians was strongly associated with partisanship. Republicans tended to evaluate Muslims less favorably than Christians (-4 vs. +24), while Democrats evaluated both groups favorably, on average, but Muslims slightly more favorably (+15 vs. +11). The differences between Democrats and Republicans in their views of Muslims were particularly large in three domains (see Appendix Table A-1): Republicans saw more Muslims as believing in a “false religion,” not respecting American law or willing to fit in, and sympathetic to terrorism or willing to engage in terrorist acts. Regarding Christians, Democrats tended to say that far more had outdated views of women, gays, and lesbians than did Republicans.
Views of Muslim and Christians were even more polarized among those most favorable to Trump — or those who said that they strongly approved of the job he was doing as president. The gap between average ratings of Muslims and Christians was largest among this group (-10 vs. +25).
The VOTER Survey’s earlier interviews with respondents in November 2012 and December 2016 allow a comparison of the views of Muslims based on how respondents reported voting in the previous two presidential elections. Unsurprisingly, reliable Republicans who voted for both Romney and Trump were quite different than reliable Democrats who voted for both Obama and Clinton. More notable is that Obama to Trump voters saw Muslims similarly to Romney to Trump voters, while Romney to Clinton voters were similar to Obama to Clinton voters. The views of Obama to Trump voters comport with other evidence showing that they had distinctly conservative attitudes on issues related to race, ethnicity, and religion.(xi)
The balance of stereotypes of both groups was also more positive among those who have more formal education (Figure 5). This is especially true for Muslims. Those with no high school degree averaged -4 on the scale of Muslim stereotypes, while those with post-graduate education averaged +13. In terms of the stereotype item about “fitting in,” those without a high school degree believed that 40 percent of Muslims want to fit in, while those with a post-graduate degree said that 63 percent do. By contrast, education did not much distinguish views of Christians on this dimension. On average, those without a high school degree believed that 71 percent of Christians want to fit in, while those with a post-graduate degree said that 76 percent do.
Figure 5
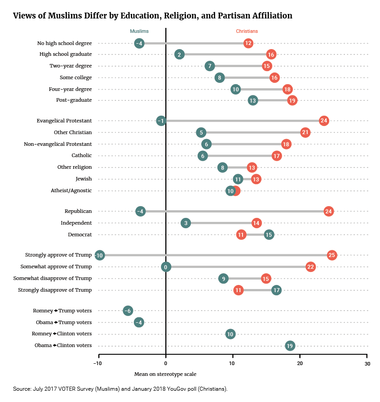
Finally, the balance of stereotypes differed among religious groups. Evangelical Protestants — defined here as those who identified as “born again” — evaluated Muslims the least favorably and Christians the most favorably. Other Christians showed a similar tendency, but with less differentiation between Muslims and Christians. By contrast, non-Christian groups, including Jews, tended to evaluate Muslims and Christians similarly with regard to these stereotypes. Those who identified as atheist or agnostic did not differentiate Muslims and Christians at all. Among these respondents, the average scores on the Muslim and Christian stereotype scales were almost identical (+10).(7)
(7) Although not displayed in Figure 4, VOTER Survey data also show that stereotypes of Muslims were less favorable among older respondents compared to younger respondents. Moreover, they were less favorable among white people compared to non-white people.
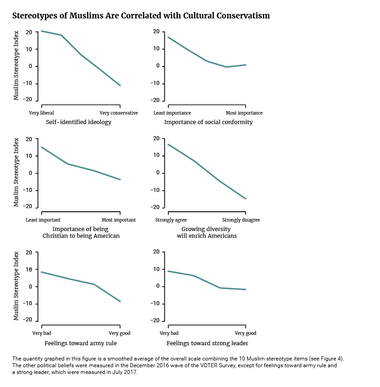
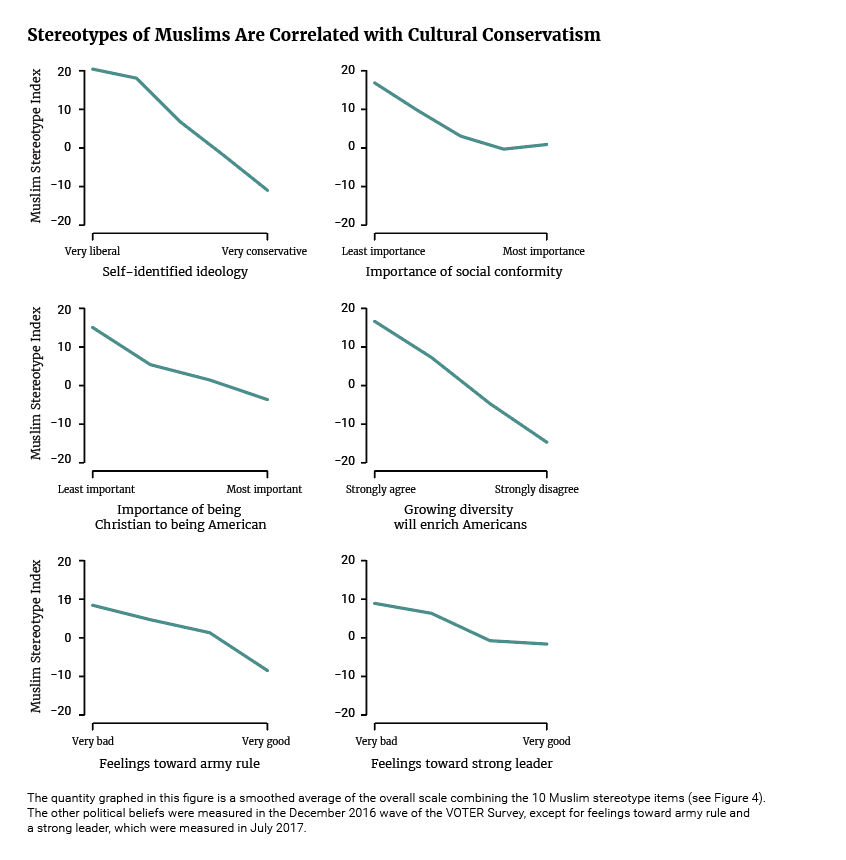
Negative stereotypes of many racial, ethnic, and religious minority groups are often tied to a constellation of culturally conservative or ethnocentric values.(xii) Stereotypes of Muslims showed this same pattern (Figure 6). Views of Muslims were more negative among those who identified as conservative, those who tended to prioritize conformity, those who believed that being Christian was important to being American, and those who did not believe that growing racial diversity would enrich the United States.(8) Similarly, those who expressed some support for nondemocratic political systems — having “the army rule” or a “strong leader who does not have to bother with Congress or elections” — had less favorable views of Muslims.
(8) A preference for conformity was measured with four items asking respondents which value they prioritized more in children: independence or respect for elders, curiosity or good manners, obedience or self-reliance, and being considerate or well behaved. This scale is sometimes used in academic literature to measure the concept of “authoritarianism.”
Figure 6
Views of Muslims were also connected to views of other social groups (Figure 7). Previous research has shown that white people with less favorable views of many different racial, religious, and cultural minorities — such as black people, Jews, atheists, gays and lesbians, and illegal immigrants — also have less favorable views of Muslims.(xiii)
Figure 7
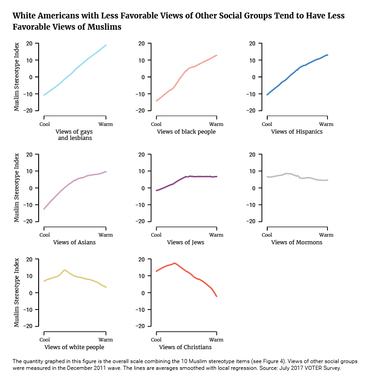
Overall assessments of Muslims on these stereotype items were more positive among white people who viewed gays and lesbians, Jews, Hispanics, and black people favorably on a 0 to 100 scale — even though views of these other groups were measured in an earlier interview almost six years prior. Only views of Mormons were not significantly correlated with views of Muslims. By contrast, views of majority groups — white people and especially Christians — and views of Muslims were negatively associated with each other.(9)
The argument is not that views of these various social groups have “caused” white Americans to have a particular view of Muslims. Instead, these correlations reveal how attitudes toward Muslims and other groups are structured. As some scholars have argued, “consistency is the mark of prejudice”— meaning that having negative attitudes toward one minority group makes it more likely that you will have negative attitudes toward many other minority groups. This is certainly true for Muslims and a range of other racial, ethnic, and religious minorities.(xiv)
(9) Because the Christian stereotype measures were part of a separate survey, we cannot compare them to views of these other social groups in this same fashion.
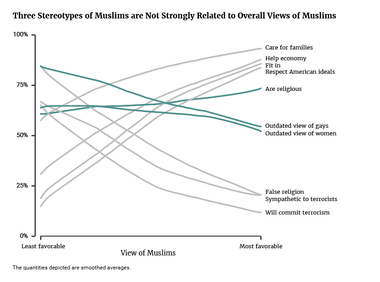
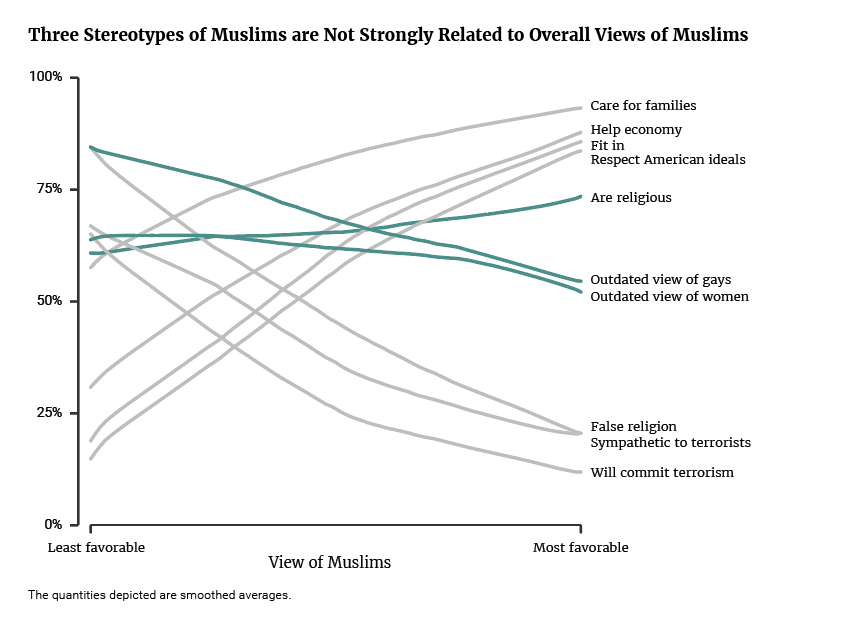
Although overall stereotypes of Muslims were polarized by partisanship and political values, this was much less true of how people viewed Muslims on three specific dimensions: their religiosity, their views of women, and their views of gays and lesbians. To see this, we compare views of Muslims on each stereotype question to their overall views of Muslims (Figure 8). Unsurprisingly, respondents who felt more warmly toward Muslims tended to evaluate them more favorably on these stereotype questions.
But on these three dimensions — “are religious,” have “outdated view of gays,” and have “outdated view of women” — the relationship between stereotypes and overall views was weaker or even nonexistent. This was because these beliefs about Muslims crossed partisan and ideological lines. For example, Democrats and Republicans said that religious devotion described similarly-sized majorities of Muslims — 67 and 65 percent, respectively (see Appendix Table A-1).
Democrats and Republicans also had similar perceptions of Muslims’ views of both women and gays and lesbians. The same is true among liberals and conservatives. This is largely because Democrats and liberals attributed these statements to far more Muslims than they attributed statements like “believes in a false religion.” As at least one other study has found, a substantial percentage of people — mostly on the political left — have a favorable opinion of Muslims overall, but less positive perceptions of how Muslims themselves view women, gays, and lesbians.(xv)
Figure 8
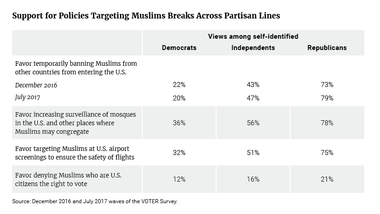
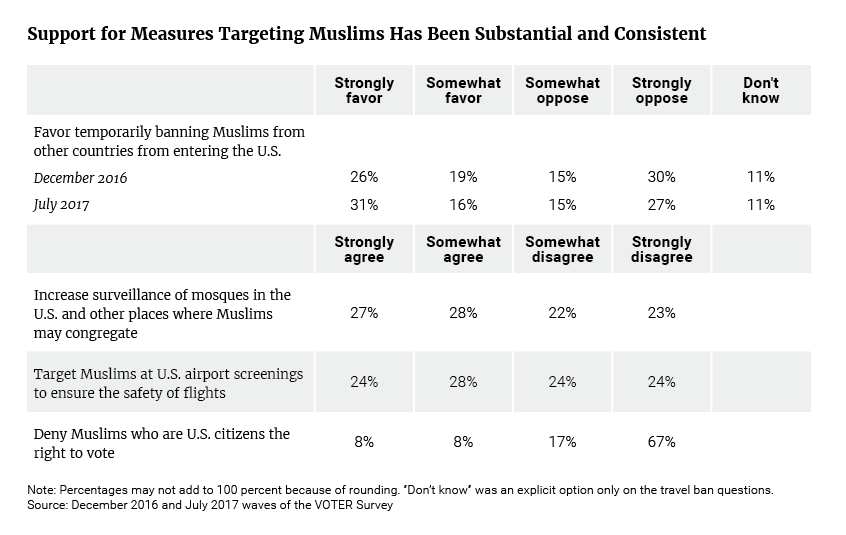
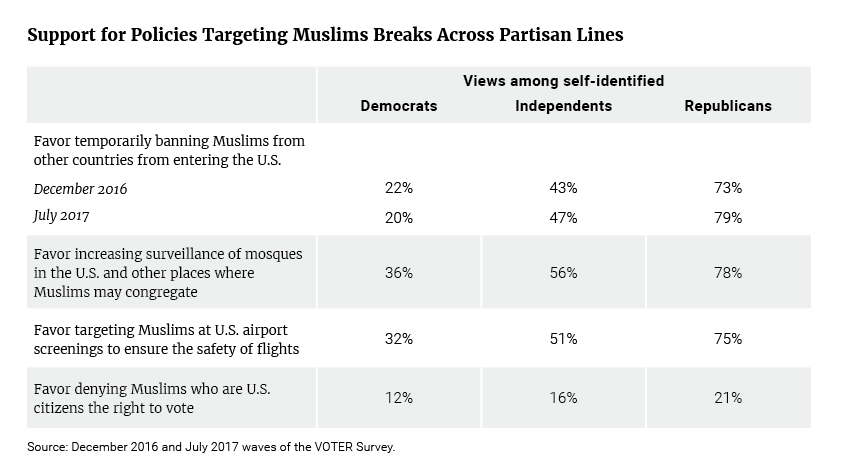
The prevalence of negative stereotypes of Muslims is mirrored in substantial support for various measures that single out Muslims as threatening (Table 1). In the July 2017 VOTER Survey, 47 percent supported a temporary ban on Muslims traveling to the United States, a slightly higher fraction than in the December 2016 survey.
Slim majorities also favored increased surveillance of mosques and other places where Muslims gather (55 percent) and targeting Muslims at airport screenings (52 percent). There was much less support for disenfranchising Muslims who are American citizens, although a minority (16 percent) was willing to do so.
Table 1
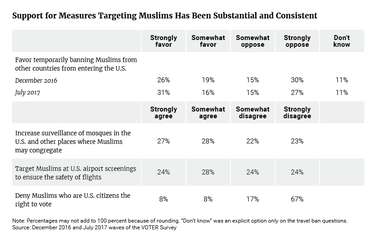
This support for surveillance and targeting is not necessarily surprising. For example, an earlier study found that a majority of Americans in 2004 approved of stopping and searching people of Arab or Middle Eastern descent; in fact, profiling Arabs was much more popular than profiling American racial or ethnic groups. Even more troubling, this same study also found that 30 percent supported “allowing the government to hold Arabs who are U.S. citizens in camps until it can be determined whether or not they have links to terrorist organizations.”(xvi)
Democrats and Republicans varied considerably in their support for policies targeting Muslims, just as they did in their views of Muslims as a group. There were gaps of 40–50 points between Democrats and Republicans in their support for a temporary travel ban, increased surveillance of mosques, and targeted airport screenings. Between December 2016 and July 2017, partisan polarization in views of the travel ban actually increased, as Democrats shifted slightly in opposition, and Republicans shifted in favor. At the same time, the one-third of Democrats who favor surveillance and screening of Muslims illustrates that a substantial fraction of the party has more conservative views on issues related to race, ethnicity, immigration, and the like.(xvii)
Table 2
There was, unsurprisingly, a clear link between stereotypes and policy attitudes: the more negative people’s perceptions of Muslims, the more willing they were to endorse these policies. For example, among the 20 percent of Americans with the most negative stereotypes, the vast majority, 90 percent or more, supported a temporary travel ban, surveillance at mosques, and airport screenings — and 36 percent supported denying Muslim Americans the right to vote. Among the 20 percent with the most positive stereotypes, 10 percent or less supported any of these policies.
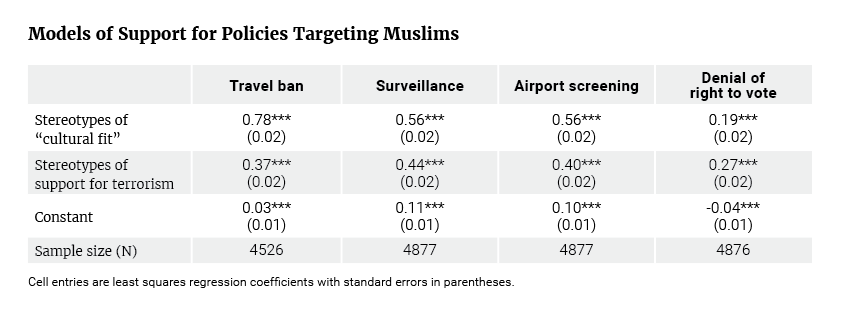
It is difficult to isolate the apparent impact of specific stereotypes, as they are highly correlated with each other. But stereotypes about the cultural fit of Muslims appeared more strongly connected to policy views than stereotypes about terrorism (see Appendix). This was true for views of the travel ban, surveillance, and airport screenings, but not vote denial. We consider this only a tentative finding at best — especially because separating dimensions of stereotypes can be difficult — but it suggests that support for limiting Muslim immigration or surveilling Muslim Americans does not simply reflect concerns about U.S. homeland security.
These correlations between stereotypes and policy views are consistent with other research. In particular, stereotyping Muslims as violent or untrustworthy was associated with greater support for various policies connected to the broader War on Terror. Because Americans judge policies based in part on how they view the groups affected by those policies, any wholesale shift in support for policies that target Muslims would likely require Americans to see Muslims in a very different light.(xviii)
How did perceptions of Muslim Americans correspond, or not, to Muslims’ own views? Survey data reveal important differences between what Muslim Americans actually think and do and what other Americans perceive.
Although Americans believed that a substantial fraction of Muslims was sympathetic to or willing to commit a terrorist act, a January–May 2017 Pew Research Center survey of Muslim Americans, conducted shortly before the July VOTER Survey, showed that Muslim Americans were as concerned, if not more concerned, than the general public about “extremism in the name of Islam” in the world and in the U.S. Moreover, three-quarters of Muslim Americans surveyed (76 percent) said that targeting and killing civilians can never be justified. By contrast, only 56 percent of the general public said that.
Additionally, although Americans believed that many Muslims do not want to be part of this country and do not have respect for American ideals, other surveys show very high levels of patriotism among Muslim Americans. In the Pew Research Center survey, 92 percent of Muslim Americans agreed that they were “proud to be an American.”(xix) In a 2016 Institute for Social Policy and Understanding (ISPU) poll, 84 percent of Muslim Americans said they identified strongly with being an American, as did 84 percent of Protestants and 91 percent of Catholics.(xx) Similarly, in the Pew survey, most Muslim Americans said that they have a lot (60 percent) or some (28 percent) in common with most Americans.(xxi)
There was also a perception that many Muslims (approximately 40 percent) did not contribute to the U.S. economy. But a 2017 ISPU study found that in state of Michigan, where Muslims make up just under 3 percent of the population, Muslim Americans contributed more than $5.5 billion to the Michigan economy in consumer spending alone — 20 percent more than the average American household. (Muslim Americans also contributed $177 million in charitable giving — 18 percent more than the average household nationally — and their giving was not just to faith groups.)(xxii) Additionally, there was a perception that most Muslims (nearly 60 percent) had an outdated view of gays and lesbians. But in the 2017 Pew survey, 52 percent of Muslim Americans took the opposite view, saying that “homosexuality should be accepted by society.”(xxiii) This was lower than in the general public as a whole — which was 63 percent in an April 2016 Pew survey — but only slightly lower among all Christians (57 percent). Interestingly, Muslim Americans expressed much more acceptance of homosexuality than did white evangelical Protestants (34 percent).
Finally, there was a perception that two-thirds of Muslims have outdated views of women. However, in a 2011 Pew Research Center survey of Muslim Americans, 72 percent agreed that women should be able to work outside the home (as did 81 percent of the U.S. public) and only 27 percent said that men make better political leaders than women (as did 13 percent of the U.S. public).(xxiv)
That most Muslim Americans reject a highly traditional view of gender roles is also visible in the actual experiences of Muslim American women. ISPU studies of Muslim Americans in 2016 and 2017 found that Muslim American women are more educated than their male counterparts: 73 percent have some education beyond high school, compared to 57 percent of Muslim American men.
In summation, the public arguably underestimates Muslim Americans’ love of this country, their desire to be part of it, and their contribution to its economy, while overestimating their support for terrorism, as well as their opposition to women’s rights and homosexuality.
Given the prevalence of negative stereotypes of Muslim Americans and the willingness to target them for surveillance and screening, it is relevant to ask: what might change these attitudes and produce a public view of Muslim Americans that more accurately reflects their actual attitudes and characteristics?
Ironically, one change agent has been President Trump himself. His often controversial views of Muslims appear to have produced a backlash among Democrats and independents, both of whom became more favorable toward Muslims and Islam in 2015–2016. As a result, opinions among Americans, overall, have become more favorable. The challenge, however, is that the views of Republicans have not shifted as much, if at all, in that direction. Democrats and Republicans have become more polarized on this issue, as on many other issues.(xxv)
This suggests that broader attitude change will likely require a different portrait of Muslims and Islam. Prior research has shown that media coverage and popular entertainment focus on the threats that Muslims pose, such as terrorism, and often portray them as exotic and devious.(xxvi) A different and more positive portrayal may lead to more favorable attitudes toward Muslim Americans. One piece of evidence comes from a November 2016 research project by Democracy Fund Voice in which participants were randomly assigned to see to different messages about Muslim Americans.(xxvii) In the message that had the largest impact, two Muslim American women, both wearing headscarves, were depicted reading and reacting to hostile Facebook comments posted after a mosque burned down in Florida. Their reactions to these comments were intended to confront subjects with the consequence of prejudice toward Muslims. Additionally, these women made other statements — such as repeatedly saying “I am an American” — that directly address the prevalent stereotype that Muslims do not want to be fully part of the United States.
After seeing this video message, the percentage of subjects with a favorable view of Muslims increased — among both Democrats and Republicans. Of course, as with all experiments, the setting here was somewhat artificial, but one can find echoes of its messages in real life — such as in events that show Muslims in the context of cooperation with other religious communities. For example, after Jewish cemeteries were vandalized in St. Louis and Philadelphia in 2017, Muslim leaders helped clean them up and raised hundreds of thousands of dollars for repair.(xxviii) And after a Texas mosque burned down, the local synagogue gave keys to members of the affected Muslim community so they would have a place to worship.(xxix) Media coverage of these incidents presented Muslim Americans in a more sympathetic light.
Given that views of social groups change slowly, a more immediate question is whether debates over issues like terrorism can be reframed so that they are not so strongly tied to Islam or to Muslims. As a 2017 Government Accountability Office report noted, a significant amount of domestic terrorism is perpetrated not by Muslims but by far-right extremists.(xxx) One question is whether a debate that more fully engages with the actual perpetrators of terrorism would reduce the linkage in many Americans’ minds between terrorism and Islam.
In the meantime, growing partisan polarization in views of Muslims and Islam only invites greater political conflict. Muslims’ own experiences reflect this conflict. In the 2016 ISPU survey, 42 percent of Muslim children in K–12 schools reported being bullied because of their faith, compared with 23 percent of Jewish children, 20 percent of Protestants, and 6 percent of Catholics. (One in four cases of bullying Muslim children involved a teacher or administrator as the bully.) Similarly, 60 percent of Muslims reported discrimination because of their religion, compared to 38 percent of Jews, and less than 20 percent of Protestants and Catholics. Muslims (38 percent) and Jews (27 percent) were also the religious groups most likely to fear white supremacist threats to their personal safety or that of their family because of the 2016 election.(xxxi)
The anxiety among Muslims is well founded. Hate crime statistics compiled by the FBI show a significant increase in assaults against Muslims. In 2016, there were 127 Muslim victims of assault, compared to 56 in 2014, and 91 in 2015.(xxxii) In reaction to these threats, many Muslim Americans have responded with increased engagement. For example, the 2017 ISPU survey found that nearly a quarter (23 percent) of Muslim Americans reported increased giving to their faith organizations, while 18 percent joined, donated, or volunteered at a civic organization for the first time.
Two weeks after the Sept. 11 attacks, President George W. Bush spoke at the Islamic Center of Washington, D.C., and said, “America counts millions of Muslims amongst our citizens, and Muslims make an incredibly valuable contribution to our country. Muslims are doctors, lawyers, law professors, members of the military, entrepreneurs, shopkeepers, moms, and dads. And they need to be treated with respect. In our anger and emotion, our fellow Americans must treat each other with respect.”(xxxiii) Nearly seventeen years later, it is clear that many political leaders and citizens do not share this view. Constructing an American identity and polity that truly respects Muslims remains a central challenge.
Table A-1
Analysis of Stereotypes and Policy Items
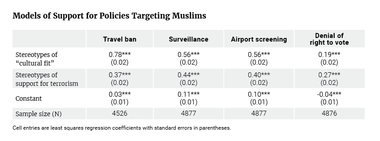
In this analysis, we averaged two indicators of Muslims’ cultural fit (the percent who want to fit in and the percent who respect American ideals) and two indicators of Muslims’ support for terrorism (the percent sympathetic to terrorists and the percent willing to commit terrorist attacks). We then estimated simple regression models of support for each policy where these indicators were the only two independent variables.
In each model, both factors were associated with support for these policies. Specifically, support was higher among those with negative stereotypes. However, the relative magnitude of the coefficients suggests that stereotypes of cultural fit, not stereotypes of support for terrorism, were more strongly associated with support for the travel ban, surveillance of mosques, and airport screening. The opposite was true for the denial of the right to vote, although the two coefficients were not very different in magnitude.
Table A-2


Subscribe to our mailing list for updates on new reports, survey data releases, and other upcoming events.

