
Economic populism is the new center
The Week November 14, 2019
Economy, Political Parties, Socio-Economic

Key Findings
Leading contenders for the 2020 Democratic presidential nomination have staked out increasingly progressive economic policy positions. Some have made criticism of wealthy people a central message of their campaigns. Where do voters stand on these issues?
In the Democracy Fund Voter Study Group’s 2019 VOTER Survey (Views of the Electorate Research Survey), conducted between November 17, 2018 and January 7, 2019, 6,779 Americans shared their views on wealth and poverty, as well as some commonly proposed policies to address economic inequality. The data shed new light on the relationship between the public’s narrative beliefs and their policy priorities, namely, how American voters explain why some people are rich and others are poor, what effects wealthy people have on society, and how views of wealthy and poor people relate to economic policy preferences.
Democratic voters were unified in their explanations about the economy and in support of progressive economic policies, while Republicans were much more divided internally. About one in five Republicans held economic views closer to the Democratic average than to their own.(1)
(1) In categorizing Democrats and Republicans, we include both self-identified partisans and partisan “leaners” — voters who, though they may classify themselves as independent, admit they lean towards one party.
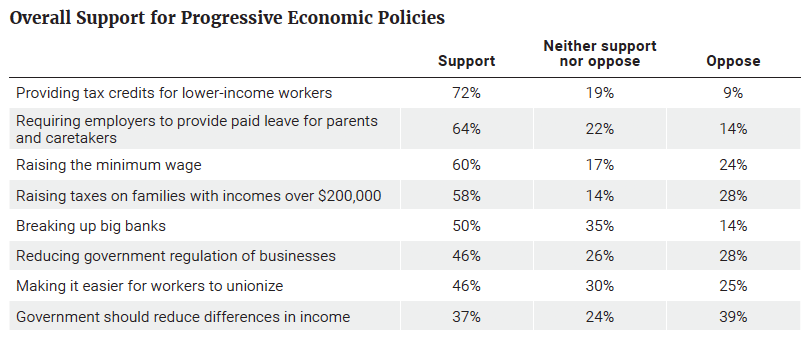
The 2019 VOTER Survey asked about eight policy proposals related to economic inequality (Table 1). Overall, Americans were most supportive of providing tax credits to low-income workers and requiring employers to provide paid family leave for parents and caretakers. Raising the minimum wage and raising taxes on families with incomes over $200,000 also received majority support. Respondents were less certain about breaking up big banks, reducing government regulation, and making it easier for workers to unionize. More respondents supported than opposed these policies, but a large percentage neither supported nor opposed, suggesting that these proposals were less salient to the public than other economic policies.
We also asked respondents whether they thought it was the responsibility of government to “reduce differences in income between those with high incomes and those with low incomes.” This proposal had lower levels of support than the more specific policies.
Table 1
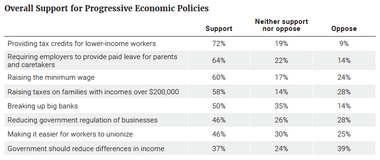
A large partisan divide exists on economic issues. For example, 72 percent of Democrats supported making it easier to unionize, compared to 37 percent of independents and only 16 percent of Republicans. Seventy-five percent of Republicans supported reducing regulation, compared to 47 percent of independents and 23 percent of Democrats. The partisan divide was smallest, but still substantial, for tax credits for lower-income workers: 86 percent of Democrats supported the policy, as did 65 percent of independents and 58 percent of Republicans.
However, intra-party divides also exist, particularly among Republicans. While Democrats at all income levels tended to express similar levels of support for progressive economic policies, lower-income Republicans were much more supportive of progressive economic policies than higher-income Republicans.
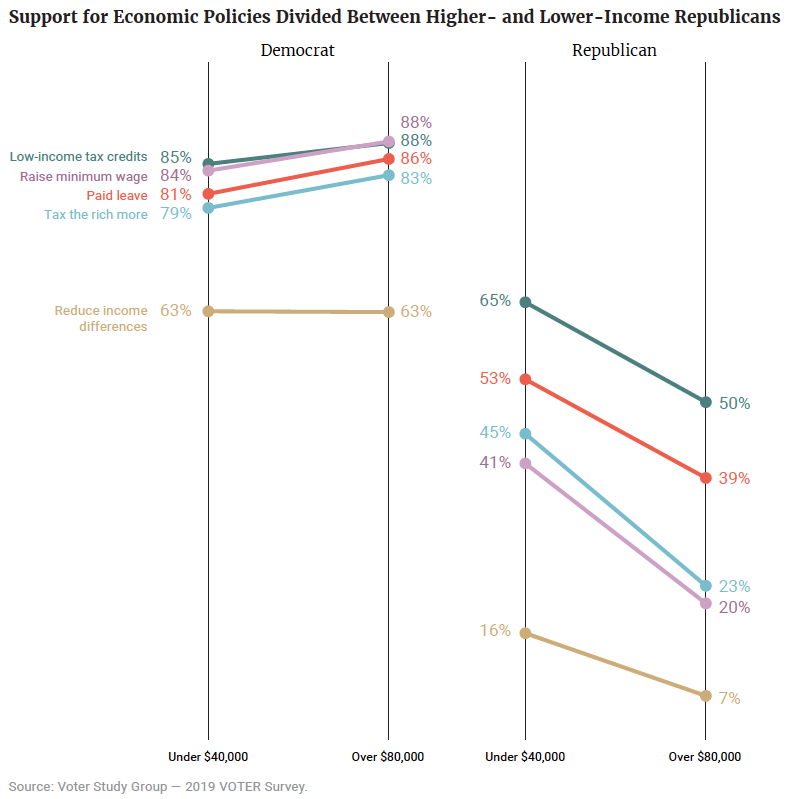
Figure 1 shows support for economic policies by party and income. For visual clarity, this figure includes only five policies, but all policies followed a similar pattern.
Figure 1

Regardless of income, more than three-quarters of Democrats supported raising the minimum wage, requiring employers to provide paid family leave, raising taxes on families with incomes over $200,000, and providing tax credits for lower-income workers. Most Democrats also supported breaking up banks, making it easier to unionize, and reducing income inequality. About three-quarters of Democrats opposed reducing regulation of businesses. Where there were divisions by income level, they were relatively small, with Democrats earning over $80,000 annually holding slightly more progressive views.
By contrast there was a substantial Republican class divide on economic issues, with lower-income Republicans (those with family incomes under $40,000 per year) reporting more progressive views than higher-income Republicans (those with family incomes over $80,000per year).(2) The majority of lower-income Republicans supported paid leave for parents and tax credits for lower-income workers. A clear plurality supported breaking up big banks (39 percent vs. 23 percent). Lower-income Republicans were about evenly split on higher taxes for families making over $200,000 (45 percent support vs. 44 percent oppose), and raising the minimum wage (41 percent support vs. 35 percent oppose). Making it easier to unionize and reducing inequality were the only policies that received little support from lower-income Republicans.
Higher-income Republicans were much more skeptical of progressive economic policies. Less than a quarter of Republicans with family incomes over $80,000 per year supported raising the minimum wage or increasing taxes on families with incomes over $200,000. The most popular progressive policy among higher-income Republicans, tax credits for low-income workers, was only supported by half of these respondents.
The Republican class divide was largest when it came to taxing families with incomes over $200,000; lower-income Republicans were 22 percentage points more likely to say they should pay more in taxes than higher-income Republicans (45 percent vs. 23 percent). Among Democrats, the class divide on taxing these families was only four percentage points — with higher-income Democrats more likely to support raising their taxes (83 percent vs. 79 percent).
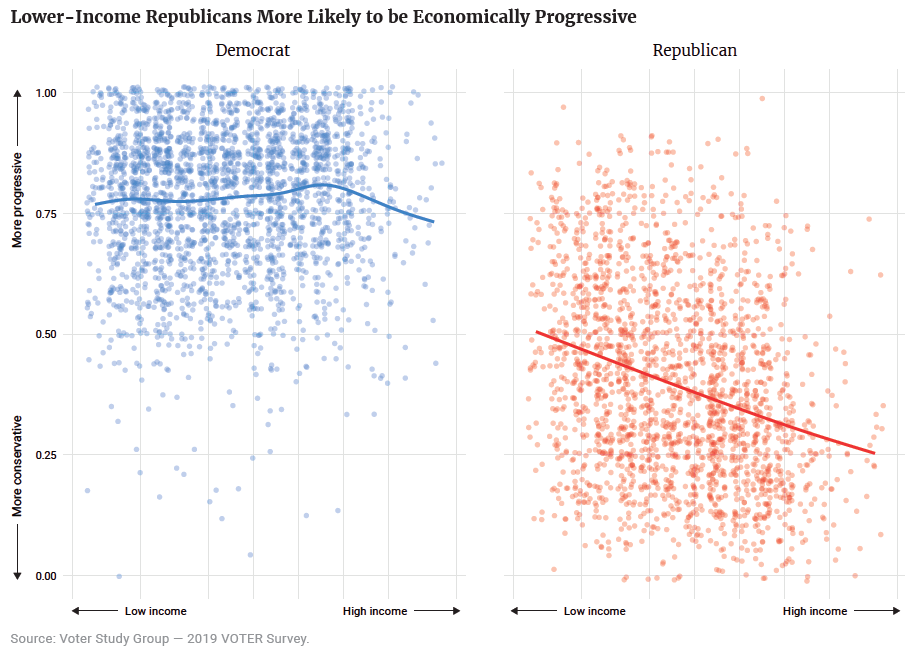
To further analyze the relationship between income and economic policy attitudes, we created a composite measure of overall policy progressiveness — averaging together respondents’ support for the eight economic policy proposals in Table 1.(3) We call this scale “economic progressivism.” Figure 2 shows the distribution of Democrats and Republicans by income level on the “economic progressivism” scale.
(2) Income is far from a perfect measure of economic class; for example, some people with low incomes have chosen a low-paying job but come from a wealthy background. A previous Voter Study Group paper, “In the Red: Americans’ Economic Woes are Hurting Trump,” reported respondents’ level of “economic distress,” based on a battery of 14 questions such as: “In the last 12 months, have you lost your job?” or “have you had difficulty making a mortgage payment or paying your rent?” If we categorize respondents by economic distress rather than by income, we find similar results to those presented here.
(3) One policy in the battery (“less regulation”) is conservative. For consistency in the economic progressivism scale, we coded opposition to less regulation as the more progressive position.
Figure 2

Democrats cluster at the top of the economic progressivism scale. This mostly held true across the income spectrum. In Figure 1, we showed that Democrats making over $80,000 a year held slightly more progressive views than Democrats making less than $40,000 a year. In Figure 2, we can see that the small upward trend over most of the income spectrum reverses — a slight conservative turn among Democrats at the very highest income levels.
For instance, about 40 percent of Democrats earning over $200,000 a year strongly supported making it easier for workers to unionize, compared to 48 percent of those making less than $200,000 a year. Fifty-eight percent of high-earning Democrats supported raising the minimum wage, compared to 67 percent of other Democrats. These results fit with academic research into the attitudes of the very wealthy, which finds that they are more economically conservative.(i)
Republicans were more diverse in their economic views and that diversity correlated with income. Higher-income Republicans were, on average, more economically conservative than lower-income Republicans. About 19 percent of Republicans held economic policy positions closer to the average Democrat than the average Republican, placing them on the “economic left.” By contrast, just 9 percent of Democrats held economic positions closer to the average Republican, placing them on the “economic right.”
On average, Republicans on the economic left had lower incomes and experienced more economic distress than Republicans in the economic mainstream of their party. Two-thirds (67 percent) of Republicans on the economic left were women. On the issues, Republicans on the economic left were distinguished by their concern for Social Security and Medicare. In contrast, Democrats on the economic right were not especially different from other Democrats in terms of income or gender. Rather, they were distinguished by their concern for social issues such as immigration, religious liberty, and crime. Both economically left Republicans and economically right Democrats reported lower levels of education, followed politics less than their co-partisans, and were less inclined to support their party’s candidate in the 2020 presidential election.
Americans’ ideas about specific policies do not develop in a vacuum. Voters have narratives about the economy that help explain, for instance, why some people are rich while others are poor, or the role wealthy people play in society. These narratives are informed by many factors including partisanship and lived experiences. To explore how common narratives about the economy relate to voters’ policy preferences, participants in the 2019 VOTER Survey also assessed an array of explanations for and implications of inequality.
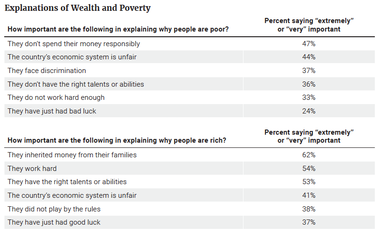
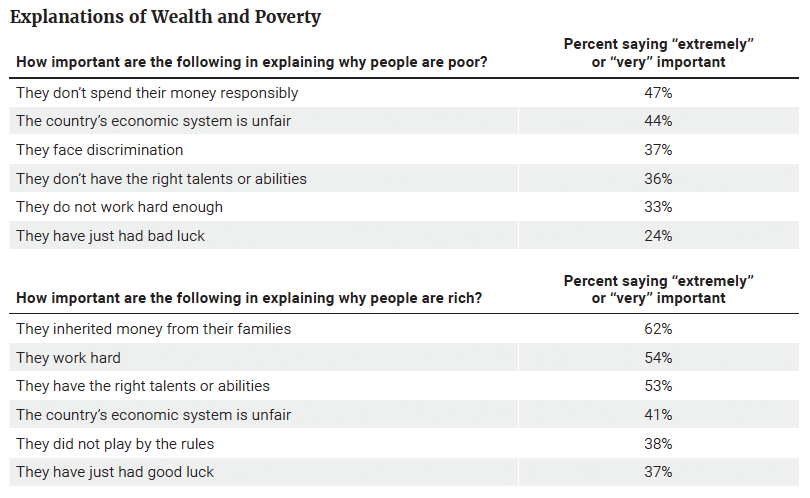
Respondents rated six potential explanations for why people are poor, and six explanations for why people are rich (Table 2). The two most popular reasons for why people are poor were “they don’t spend their money responsibly” and “the country’s economic system is unfair.” Asked why people are rich, the most popular answer was “they inherited money from their family,” followed by “they have the right talents or abilities.” In both cases, the least popular explanation was “luck.”
Table 2
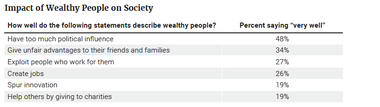
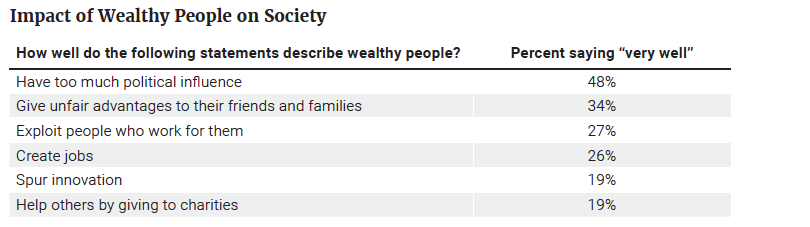
Respondents also assessed a series of effects wealthy people might have on society. Most popular were the ideas that wealthy people “have too much political influence” and that they “give unfair advantages to their friends and families.”
Table 3
The sources of poverty and wealth are complex, of course, and many respondents thought multiple factors played an important role. But we found that respondents’ explanations of inequality tended to group together — emphasizing individual-based explanations (like work, talents, and spending habits), systemic explanations (like an unfair economy and discrimination), or luck.(4)
Similarly, though the effects of wealth on society are complicated, and respondents rated multiple effects as important, they tended to emphasize either a positive story or a negative story about the behavior of wealthy people. Either respondents tended to see the rich as charitable, innovative, job creators, or they leaned toward seeing the rich as exploiting their employees, helping their friends, and having too much political influence.
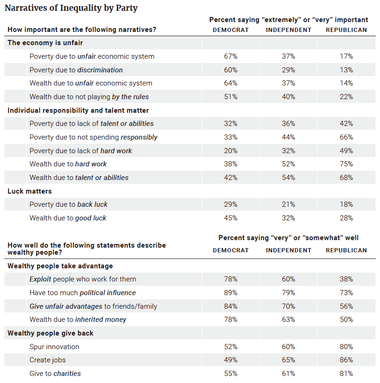
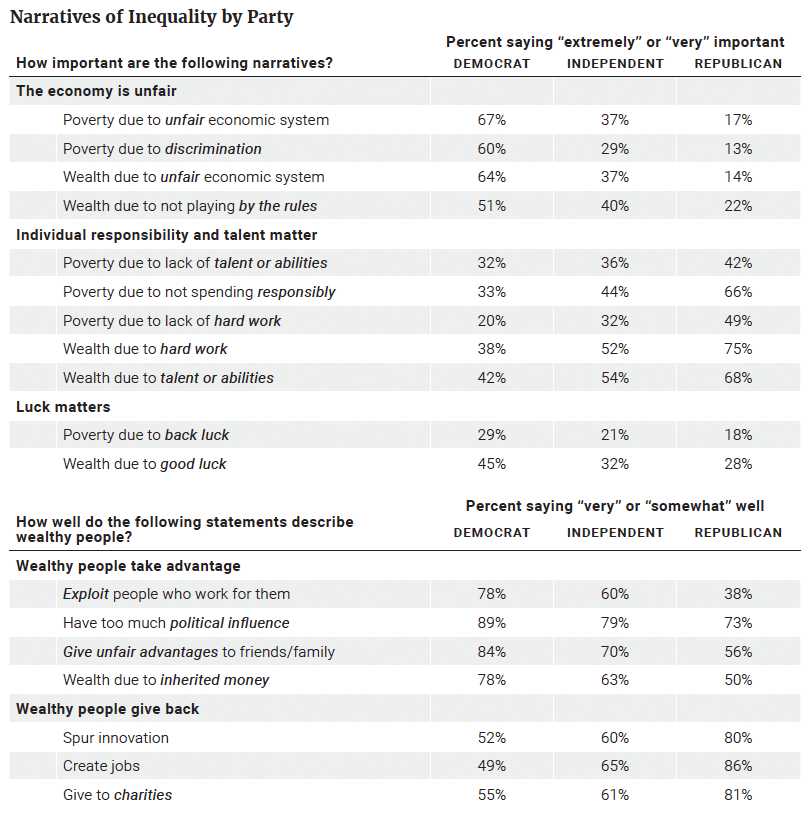
In other words, respondents’ specific answers fell into certain overarching narratives about inequality. Table 4 summarizes the five narratives about inequality along with partisans’ views of these narratives. Democrats were more likely to rate systemic explanations of poverty and wealth, such as discrimination or an unfair economy, as “important” and were also more likely to rate luck as “important.” Republicans were more likely to rate individual explanations, such as work and spending habits, as “important.”
(4) Based on a latent variable factor analysis, we determined that our larger set of questions (related in Tables 2 and 3) could be simplified into five factors, each representing a different underlying narrative about how respondents believe wealth and poverty operate in the United States.
Table 4
Figures 3 and 4 bring together the data in Table 4.
In Figure 3, we focus on the individual versus systemic explanations for inequality, because only a small percentage of respondents preferred “luck” as an explanation. The average of respondents’ ratings of the “unfair system” explanations is on the vertical axis. If a respondent picked “extremely important” for all five systemic explanations of inequality, they would be at the top, and if a respondent rated all five systemic explanations “not important at all,” they would be at the bottom.
The average of respondents’ ratings of the “individual responsibility” explanations is on the horizontal axis. A respondent who rated all five individual explanations (such as work, talent, and spending) as “extremely important” would be at the right-hand side of the graph, while a respondent who rated those factors “not important at all” would be on the left-hand side of the graph.
Looking at Figure 3 as a whole, we can compare how strongly respondents subscribe to individual factors versus systemic explanations for inequality. Above the dotted line, respondents rated systemic explanations as “more important” than individual explanations; 76 percent of these respondents were Democrats, 11 percent were Republicans, and 13 percent were independents. Below the dotted line, respondents rated individual factors as “more important”; 65 percent of these respondents were Republicans, 19 percent were Democrats, and 16 percent were independents.
Figure 3
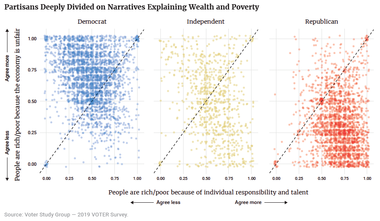
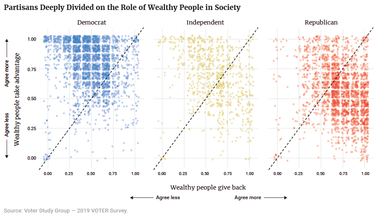
Figure 4 compares competing narratives about whether wealthy people take advantage of their position or give back. The vertical axis represents a measure that averages respondents’ ratings of the ways wealthy people take advantage, while the horizontal axis represents a measure that averages respondents’ ratings of the ways wealthy people give back. Again, Democrats are clustered above the dotted line because they were more likely agree with statements that emphasized how wealthy people take advantage of their position (exploiting those who work for them, giving unfair advantages to friends and family, etc.). By contrast, Republicans are clustered below the dotted line because they were more likely to agree with statements that emphasized how wealthy people give back to society (creating jobs, giving to charity, etc.). Sixty-five percent of those above the dotted line are Democrats, and 67 percent of those below the dotted line are Republicans. As in Figure 3, independents are more scattered than Democrats or Republicans.
Figure 4
Similar to differences in economic policy preferences, household income marks an intra-party division when it comes to explaining economic inequality; higher- and lower-income Republicans subscribed to drastically different explanations of inequality, while Democrats held largely similar views across incomes.
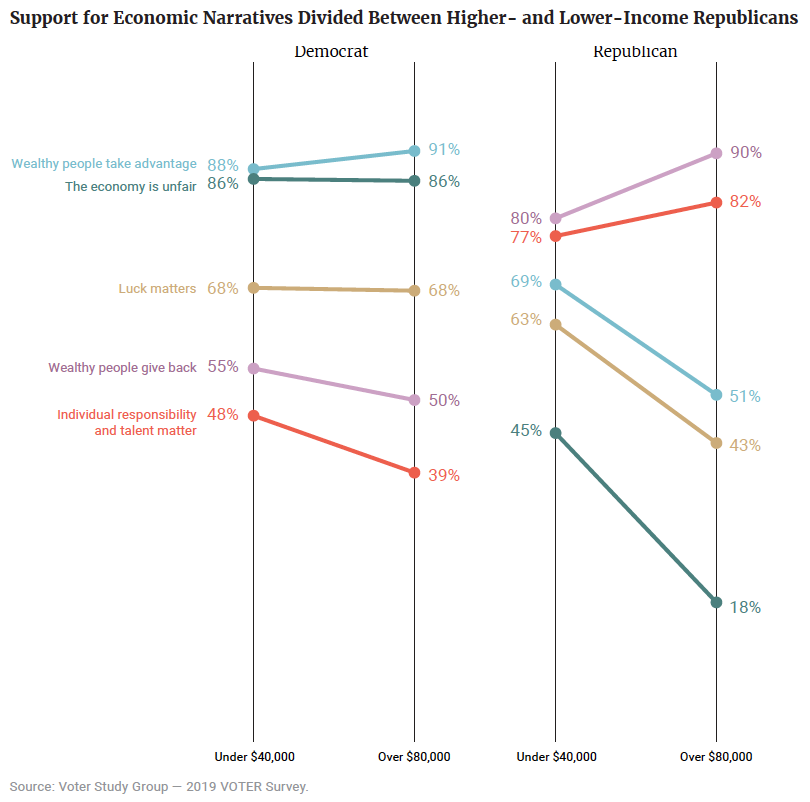
Figure 5 shows the differences between lower-income voters and higher-income voters in both parties. Specifically, it shows how strongly they subscribed to the five narratives about the economy shown previously in Table 4.(5) The percentages represent the share of respondents in each category who agreed more than they disagreed with each narrative.
(5) The five narratives, again, are: “The Economy is unfair”; “Individual responsibility and talent matter”, “Luck matters”; “Wealthy people take advantage”; and “Wealthy people give back”.
Figure 5
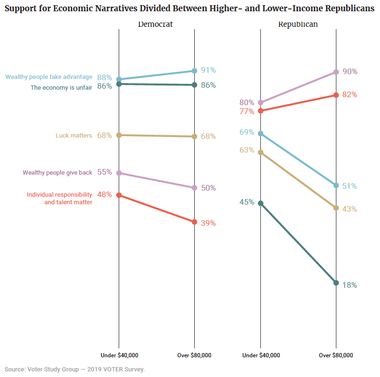
Among Republicans earning less than $40,000 annually, 45 percent held attitudes about the economy that, largely, blamed systemic unfairness for economic inequality. By contrast, among Republicans earning over $80,000 annually, just 18 percent shared that view — a 27 percentage-point gap. Democrats showed no class divide on this question, with 86 percent of higher-income and lower-income Democrats holding attitudes that blame economic inequality on an unfair system. Similarly, lower-income Republicans were substantially more likely than higher-income Republicans to hold beliefs that, on balance, ascribe economic outcomes to luck and to believe that rich people take advantage of their position.
Among Democrats, the biggest divide was individual responsibility. Lower-income Democrats were nine percentage points more likely than higher-income Democrats to see individual responsibility as being a good explanation for economic inequality (48 percent vs. 39 percent).
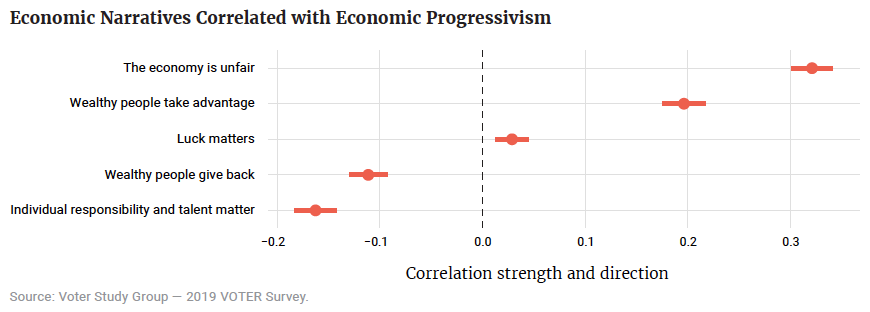
According to the 2019 VOTER Survey, the narratives a person believes about the economy are linked to their public policy preferences — even after taking respondents’ economic situations and other factors linked to political attitudes into account.
Figure 6 presents the results of a statistical model assessing the relationship between the economic narratives and respondents’ support for progressive economic policies.(6)
Figure 6

(6) The model also accounts for partisanship, ideology, income, education, political engagement, race, and gender. This means that any relationships between attitudes and policy preferences are not just the result of differences of opinion between Democrats and Republicans, women and men, or white people and people of color, and so on. How respondents think about the economy working correlates with their policy preferences, and the more strongly respondents believe the economy is unfair, and wealthy people exploit more than they give back, the more likely and strongly they will support policies that reduce inequality.
Positions such as seeing the economic system as unfair and wealthy people as taking advantage of their position are correlated with support for progressive economic policies. Crediting success to luck is slightly associated with more progressive policy positions. On the other hand, seeing wealth as the result of personal responsibility and believing wealthy people give back to their communities are associated with less support for progressive economic policies.
Relationships between attitudes do not necessarily mean that one attitude causes the other. The data presented here cannot show whether the narratives have the capacity to convince voters to hold different policy views. It cannot demonstrate, for instance, that a politician describing the economy as “unfair” would necessarily convince people that the minimum wage should be increased, or that a politician who emphasizes wealthy people donating to charity will reduce support for progressive taxation. But the data do suggest that politicians using these different narratives will find sympathetic voters nodding along, because this is already how they think about the economy.
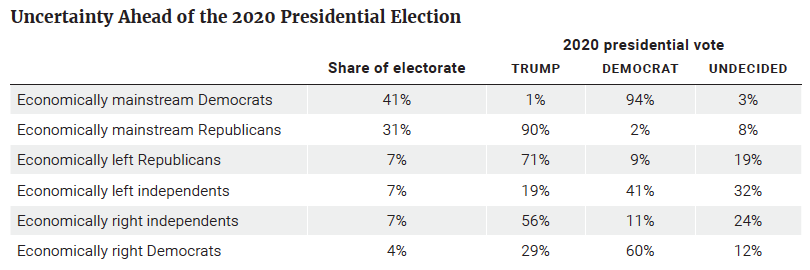
Voters’ economic attitudes also have implications for the 2020 election. In this section, we look at voting intentions and histories among different economic segments of the electorate, distinguishing the “economically right” Democrats from “economically mainstream” Democrats, and “economically left” Republicans from “economically mainstream” Republicans. We also analyze independents, distinguishing those who are closer to the average Democrat as “economically left,” and those who are closer to the average Republican as “economically right.”
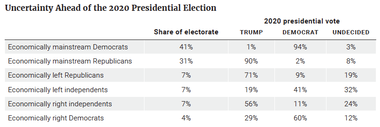
Table 5 shows these groups as a percentage of the electorate and whom they plan to vote for in the 2020 presidential election: President Trump, a generic Democrat, or undecided.(7) Predictably, partisans who were in line with their party on economics were likely to vote for their party’s presidential candidate. Independents were most likely to be uncertain about their vote, and partisans with economic preferences at odds with their party were more likely than mainstream partisans to be undecided.
Among economically left Republicans — representing 7 percent of the electorate — 9 percent said they would vote for the Democrat in 2020, and 19 percent were undecided. Among economically right Democrats surveyed — representing 4 percent of the electorate — 29 percent said they would vote for Trump in 2020, and 12 percent were undecided.
(7) A small percentage also said they do not plan to vote, but those percentages are not reported here.
Table 5
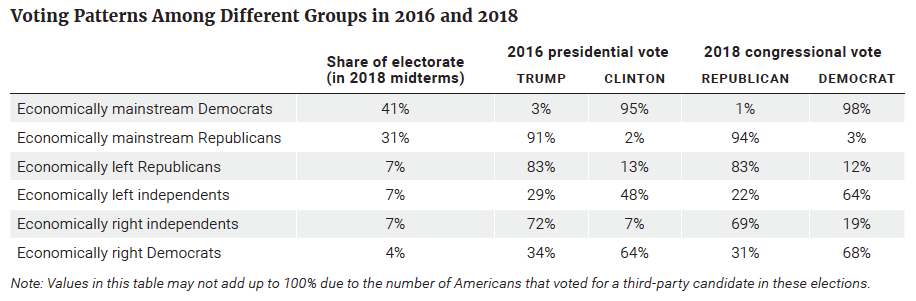
Past voting behavior for these groups is consistent with how they intend to vote in 2020. Table 6 shows the share of voters in each category supporting their party’s presidential candidate in the 2016 election and their party’s congressional candidate in the 2018 midterm elections. More than 90 percent of partisans in the economic mainstream of their party support their party’s candidates, and majorities of partisans outside of their party’s economic mainstream still vote in line with their partisanship on Election Day. Using data from the 2016 and 2019 VOTER Surveys, it’s clear that those identified as economically right Democrats today voted for the Democratic candidate at lower rates than economically left Republicans voted for the Republican candidate.
The most sizeable voting shift came from economically left independents. About half (48 percent) of this group voted for Hillary Clinton in the 2016 presidential election, but in the 2018 midterm elections, nearly two-thirds (64 percent) voted for the Democratic candidate in their congressional district. Since these voters make up 7 percent of the electorate, an increase from 48 percent to 64 percent (16 percentage points) represents a one percentage-point shift in the overall election results.
Table 6
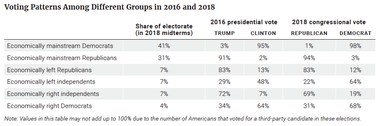
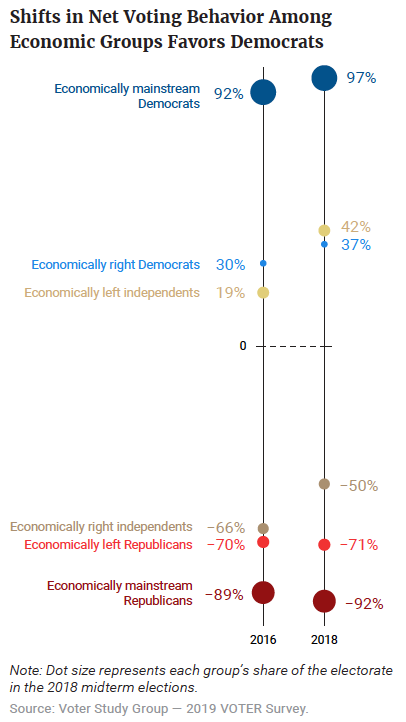
Figure 7 shows the shifts in net support among the different groups in the 2016 presidential election and the 2018 midterm elections. These values are derived by taking the percent of a group that voted for the Democratic candidate and subtracting the percent of that group that voted for the Republican candidate. As such, positive values indicate a group that leaned Democratic while negative values indicate a group that leaned Republican.
Democrats made gains among three groups: economically left independents (+19 percent vs. +42 percent), economically right independents (-66 percent vs. -50 percent), and economically right Democrats (+30 percent vs. +37 percent). Democrats made no gains among Republican identifiers and leaners.
Figure 7

Democratic voters consistently support progressive economic policies, regardless of their personal income. Across income levels, they also share a vision of the economy that emphasizes systemic unfairness and wealthy people taking advantage of their position.
Republicans are more divided on these questions, with lower-income Republicans especially likely to support more progressive economic policies and to hold economic narratives closer to the typical Democrat. Upper-income Republicans, by contrast, are more likely to think individual responsibility and talents explain why some people are rich and why others are poor, and to believe that wealthy people generally give back to society.
Moreover, respondents’ economic narratives about why some people are rich and others are poor, and what role wealthy people play in society, are good predictors of their support for progressive economic policies. The relationship between economic narratives and policy preferences holds up even if one accounts for many of the demographic and social factors that typically explain political attitudes.
Partisanship is a powerful force, but the votes of Democrats and Republicans outside of their party’s economic mainstream are more likely to be up for grabs ahead of the 2020 presidential election. Since one in five Republicans hold economic policy preferences closer to the average Democrat, while one in 10 Democrats hold economic policy preferences close to the average Republican, economic policies have the potential to play a pivotal role in the 2020 election.
Democrats did make gains among economically left independents in the 2018 midterm elections, as compared to the 2016 presidential election. If they can sustain these gains, they can increase their vote share by about 1 percent.
Tables 1, 2, and 4, along with some corresponding copy, were corrected and updated on June 11, 2019, hours after initial publishing.


Subscribe to our mailing list for updates on new reports, survey data releases, and other upcoming events.

